Bitcoin Price Key Highlights
- Bitcoin price has sold off sharply recently but it looks like bears may be tired from the dive.
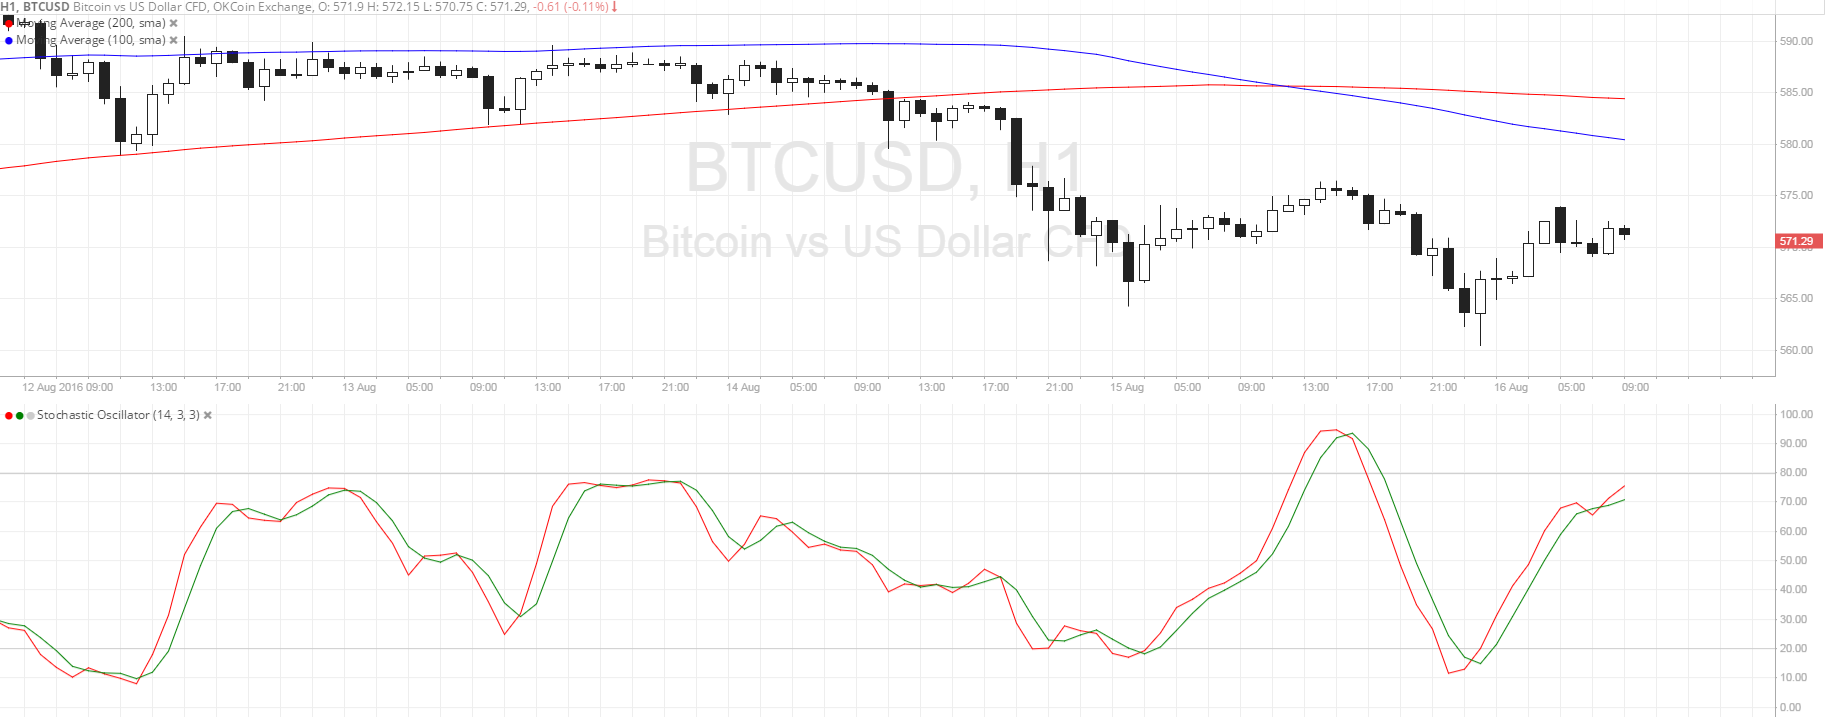
- A small double bottom pattern has emerged after price failed in its last two attempts to break below $565.
- Price has yet to break past the neckline at $575 before confirming the potential rally.
Bitcoin price could be due for a short-term uptrend once it confirms this reversal formation, but technical indicators are suggesting otherwise.
Technical Indicators Signals
The 100 SMA is below the longer-term 200 SMA so the path of least resistance is to the downside. In addition, the gap between the moving averages is widening, which reflects stronger bearish pressure.
If bitcoin price does break past the double bottom neckline, it could find dynamic resistance at these moving averages, which are around $580 to $585. A break past these levels could confirm that bullish momentum is underway.
Stochastic is on the move up, also hinting that buyers may be in control of bitcoin price action for now. However, the oscillator is nearing the overbought area so sellers might need to take over soon. In that case, bitcoin could head back to the bottoms around $560-565 or even lower.

Market Events
Commodities and US stock indices posted strong gains yesterday, indicating that risk appetite is present at the start of the week. This may have been spurred by mostly stronger earnings reports for Q2 and expectations that the FOMC minutes might contain a hint of caution, likely leading the Fed to keep borrowing costs low for the rest of the year.
Expectations of additional stimulus from China are also supporting demand for riskier assets like bitcoin, as easing from the world’s second largest economy could shore up overall growth. Other event risks for the week include top-tier UK data (CPI, jobs, retail sales), RBA minutes, and New Zealand reports (quarterly jobs and PPI) which might also reinforce further easing expectations from their central banks if the numbers come in weak.
Apart from that, crude oil price action could also influence bitcoin price gains, which appear to be trailing the commodity recently.
Charts from SimpleFX