Bitcoin Price Key Highlights
- Bitcoin price seems to need a break from its strong climb as the price is forming a short-term reversal pattern.
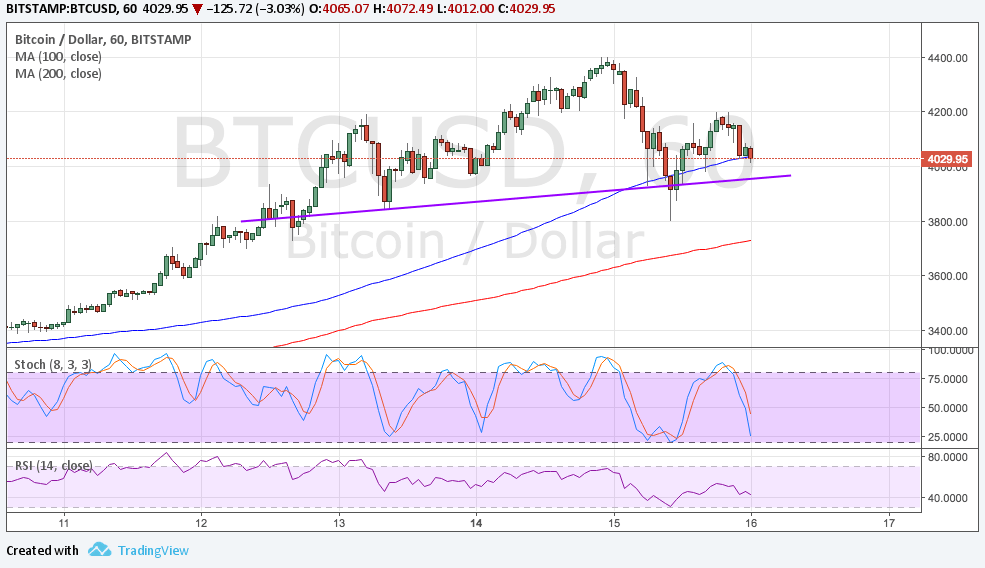
- Price is completing a head and shoulders pattern on the 1-hour time frame and looks ready to test the neckline at $4000.
- A break below the $4000 level could lead to a $400 drop or the same height as the chart formation.
Bitcoin price is forming a head and shoulders pattern on its 1-hour time frame to signal a potential selloff.
Technical Indicators Signals
The 100 SMA is still above the longer-term 200 SMA to signal that the path of least resistance is still to the upside. The 100 SMA is also holding as dynamic support at the moment and a break lower could lead to a move down to the 200 SMA dynamic inflection point around $3750.
Stochastic is also on the move down to indicate the presence of bearish momentum. RSI seems to be pulling up from the oversold area to indicate a return in buying pressure but this oscillator seems to be turning back down again.
If the neckline support continues to hold, bitcoin price could bounce back up to the recent highs near the $4400 mark. A break past these record highs could put it on track towards the $5000 major psychological level and beyond.

Market Factors
Returning risk appetite has led investors to book profits off their Bitcoin positions as North Korea has shown signs of backing down from its missile strike threats on Guam. If this kind of sentiment keeps up, Bitcoin price could head below the reversal formation and confirm the downtrend.
On the other hand, a return in risk aversion could allow Bitcoin price to resume its climb. Apart from that, the upcoming FOMC meeting minutes could also weigh on the dollar if policymakers douse hopes of a September hike. Traders are also expecting to see more details on the balance sheet runoff, which is expected to start next month.