Bitcoin Price Key Highlights
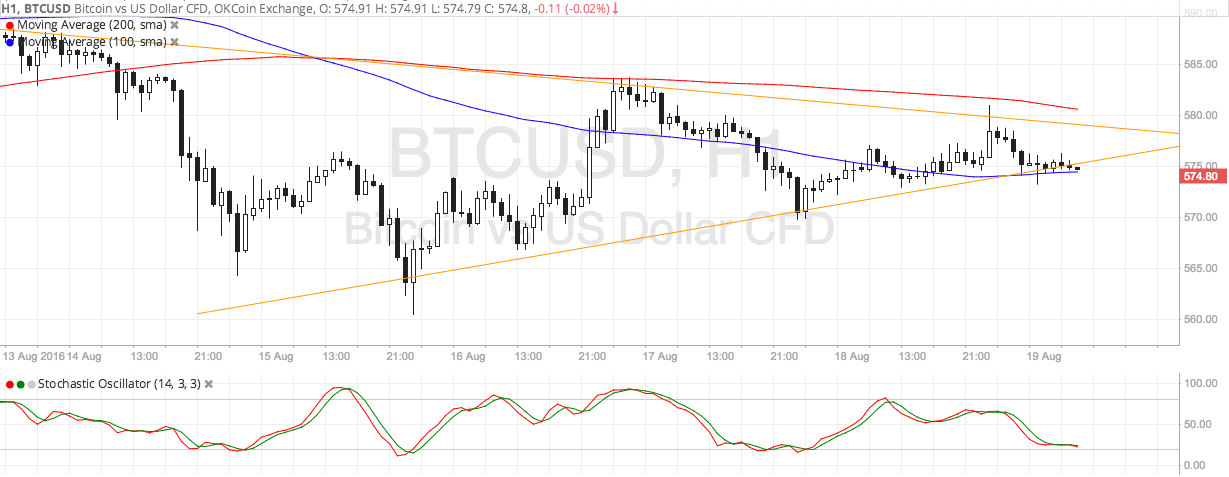
- Bitcoin price has been stuck in consolidation for a while, forming lower highs and higher lows inside a symmetrical triangle pattern.
- Price is currently testing support and is approaching the peak of the pattern, which suggests that a breakout could take place soon.
- Technical indicators seem to be favoring a downside move at this point.
Bitcoin price looks ready to break out of its symmetrical triangle consolidation pattern, which could determine its longer-term direction.
Technical Indicators Signals
The 100 SMA is still below the 200 SMA so the path of least resistance is still to the downside. However, price seems to be finding support at the 100 SMA dynamic inflection point for now.
If a bounce takes place, bitcoin price could still test the triangle resistance at $580, which is close to the 200 SMA dynamic inflection point. A breakout in either direction could lead to a rally or decline of $20, which is the same height as the chart formation.
Stochastic is treading lower, suggesting that sellers are in control of bitcoin price action for now. Once this oscillator reaches the oversold area and turn higher, buyers could take control and push for bitcoin gains.

Market Events
While the FOMC minutes weighed on the dollar earlier this week due to the less hawkish than expected bias, the US dollar has been able to advance against bitcoin price on the return in risk aversion. Apart from that, a couple of Fed officials have reiterated their upbeat outlook, reminding market watchers that the US is still one of the stronger-performing economies.
There’s not much in the way of top-tier economic releases for the remainder of the week, which means that market sentiment could be the primary driver of price action. Keep in mind that bitcoin price volatility typically picks up towards the end of the week and onto the weekend, as the lower liquidity and profit-taking activity lead to sharper moves then.
Charts from SimpleFX