Bitcoin Price Key Highlights
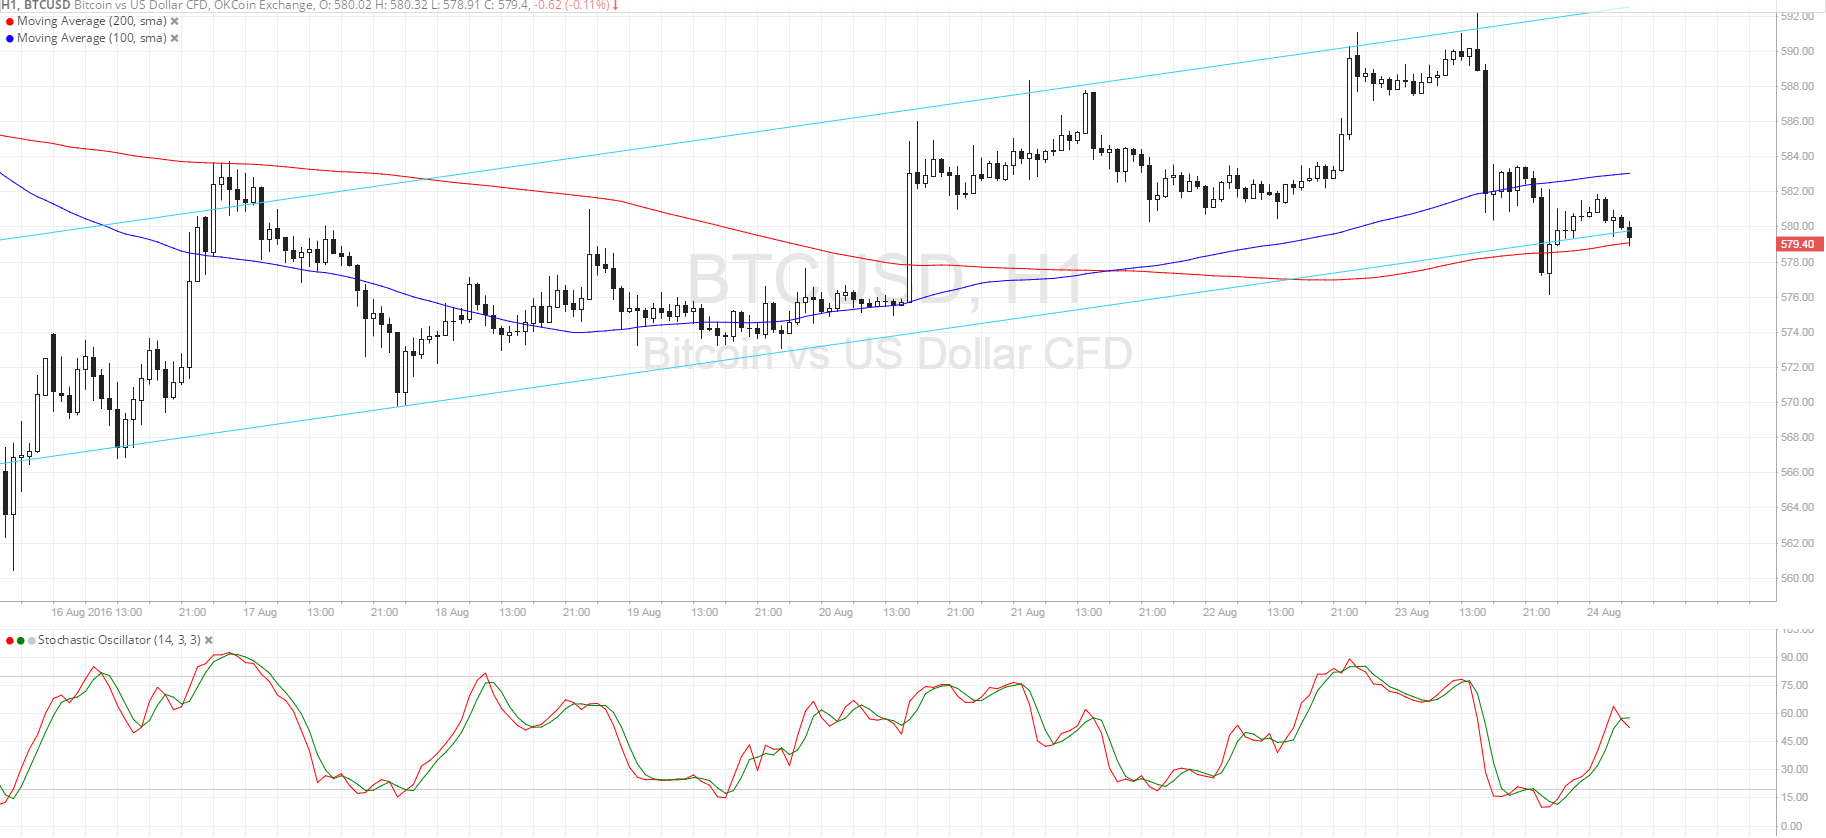
- Bitcoin price is still trending higher, moving inside the ascending channel visible on its 1-hour time frame.
- As illustrated in the earlier article, price made its way back to the channel support after getting rejected on its test of resistance.
- Support around $580 seems to be holding so far and technical indicators are suggesting that the climb could continue.
Bitcoin price is testing the ascending channel support, still deciding whether to resume the uptrend or break lower.
Technical Indicators Signals
The 100 SMA is above the longer-term 200 SMA, hinting that the path of least resistance is to the upside and that the trend could carry on. Bitcoin price is finding support at the 200 SMA dynamic inflection point as well, which could be the line in the sand for this uptrend. A break below the 200 SMA could be an early signal that a downtrend is in the works.
Stochastic is on middle ground on its way higher, which suggests that there may some bullish pressure left. However the oscillator could be turning lower as a downward crossover is forming, hinting at a possible return in bearish momentum.
If so, bitcoin price could head down to the next support area at $575 where it previously consolidated. A bounce off the channel support, on the other hand, could spur a rally to the $590 resistance.

Market Events
US economic data was mostly weaker than expected yesterday, leading market participants to predict that the Fed would be inclined to keep interest rates low for much longer. Interestingly enough, this spurred dollar strength against bitcoin price as US stock indices managed to chalk up gains.
Commodity prices were also slightly weaker when data from China suggested a slowdown in demand. Expectations are still running high for an OPEC production cut in their meeting next month and Iran has expressed willingness to cooperate in joint action, although its government has reiterated that they have yet to reclaim market share.
Moving forward, market sentiment and dollar demand could continue to dictate bitcoin price action ahead of the highly-anticipated Jackson Hole Symposium.
Charts from SimpleFX