Bitcoin Price Key Highlights
- Bitcoin price broke below the ascending channel support on its 1-hour chart, signaling that a reversal from the uptrend is in order.
- Technical indicators are still showing that the rally could resume at some point.
- A pullback to the broken channel support could take place before the selloff gains traction.
Bitcoin price seems to be done with its climb, as sellers pushed for a break of the near-term channel support.
Technical Indicators Signals
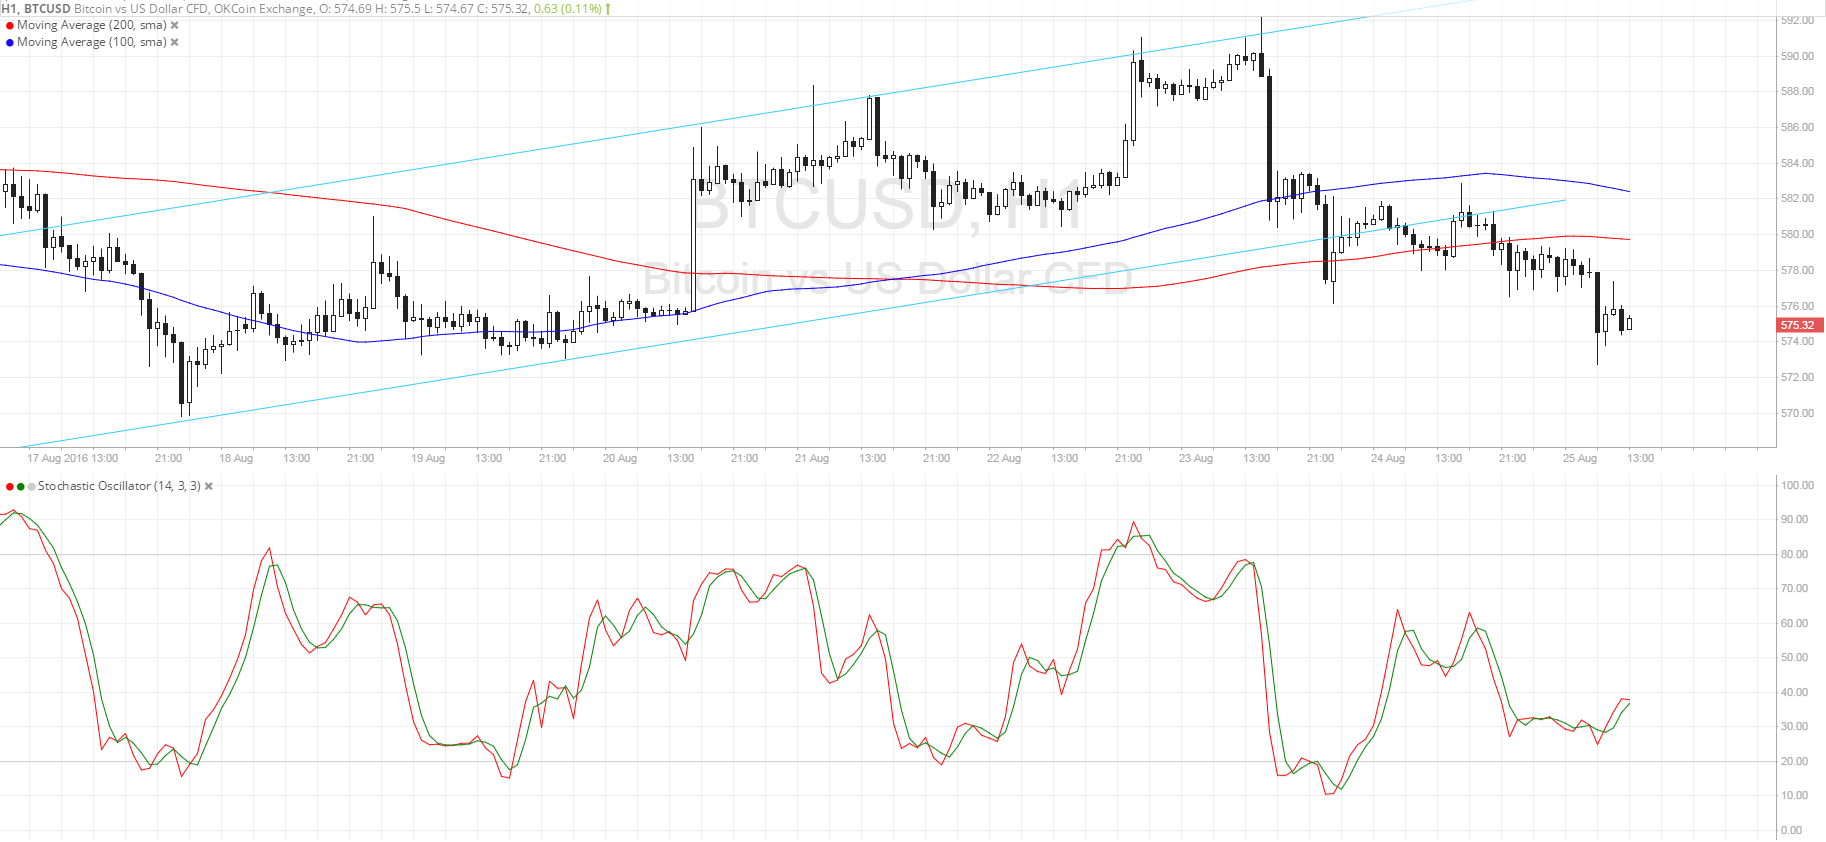
The 100 SMA is still above the longer-term 200 SMA so the path of least resistance is still to the upside. However, the gap between the moving averages is narrowing so a downward crossover might be possible, indicating a return in selling pressure.
A continued drop could take bitcoin price to the $575 area next, then onto the longer-term area of interest at $550. However, stochastic is pointing up and might be hinting that bulls could put up a fight. In that case, bitcoin price could still retreat to the broken support at $580 before heading further south.
A stronger return in buying pressure could take bitcoin back up to the channel resistance close to $590, although it would take a strong market catalyst to let that happen.

Market Events
Dollar strength carried on for the third day in a row, as risk aversion seems to be setting in the financial markets. Data from most major economies has been weaker than expected and even though the US printed its fair share of disappointing figures, investors are still drawn to the safe-haven dollar.
Apart from that, traders might be pricing in expectations of hawkish remarks from Fed Chairperson Yellen in her Jackson Hole Symposium testimony. A few policymakers have already given an upbeat assessment of the US economy, which has led many to believe that the Fed head would be upbeat as well.
A major disappointment in her Friday speech could lead to a sharp unwinding in dollar gains, possibly boosting bitcoin price in the process.
Charts from SimpleFX