Bitcoin Price Key Highlights
- Bitcoin price recently broke below a short-term uptrend formation, signaling that a selloff was in order.
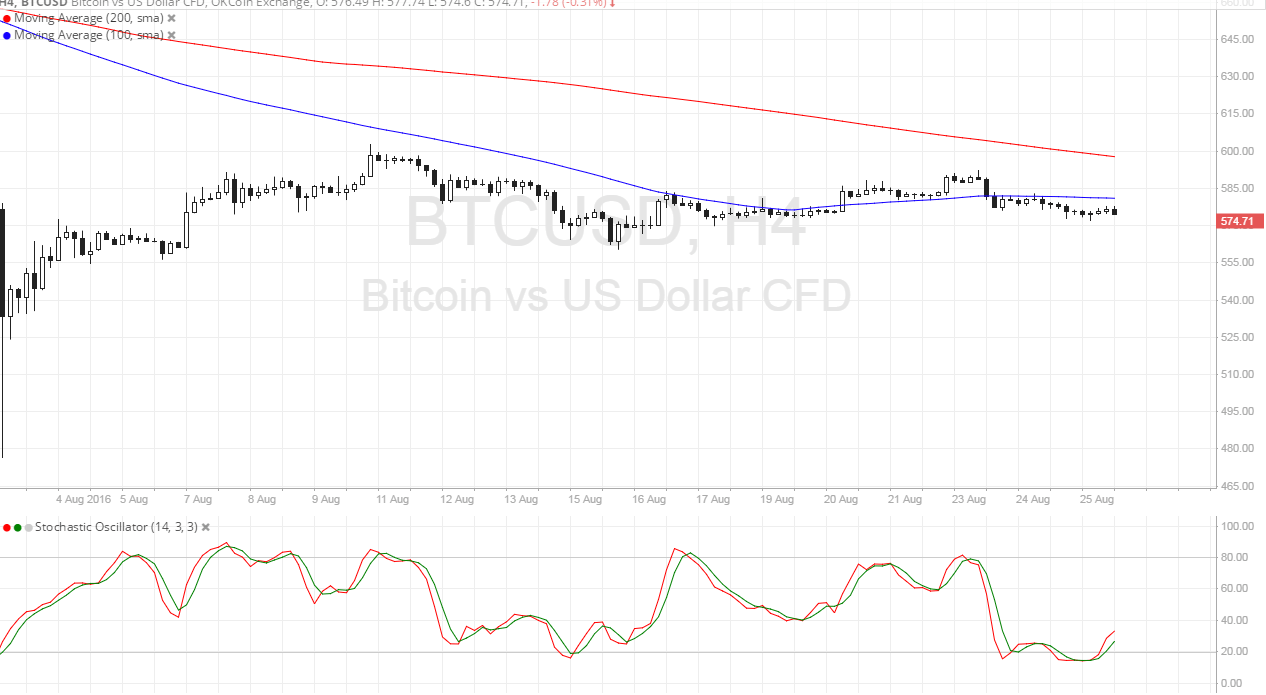
- On the 4-hour time frame, bitcoin is showing more reversal signals after it failed in its last two attempts to break past the $590 area.
- A small double top pattern can be observed on this chart, with price still gearing up to test the neckline support.
Bitcoin price could be due for more losses once it breaks below the double top neckline around $560.
Technical Indicators Signals
The 100 SMA is below the longer-term 200 SMA on this time frame, confirming that the path of least resistance is to the downside. However, the gap between the moving averages is narrowing, which suggests that an upward crossover and return in bullish pressure could be possible.
Stochastic is also on the move up, hinting that buyers could take control of price action. A bit of bullish divergence can be seen since stochastic made lower lows since mid-August while price had higher lows then. In that case, bitcoin price could head up to the previous resistance around $590-600, which is close to the 200 SMA dynamic inflection point.
On the other hand, a strong break below the neckline could send bitcoin lower by $30, which is roughly the same height as the double top formation. This might lead to a drop all the way down to $530.

Market Events
The US dollar has been drawing support from strong fundamentals and a return in risk aversion these days, especially since traders are counting on Fed Chairperson Yellen to acknowledge the improvements in the US economy during her Jackson Hole testimony. If she sounds upbeat enough, traders could continue to price in the odds of another Fed rate hike before the end of the year.
In that case, bitcoin price could continue to give up ground as traders put more funds in the safe-haven dollar. A rate hike would not only increase the returns in holding US assets but it could potentially weigh on business investment and consumer spending, keeping a lid on risk rallies.
Charts from SimpleFX