Bitcoin Price Key Highlights
- Bitcoin price is still hovering around its record highs, still deciding whether to make a bounce or a break.
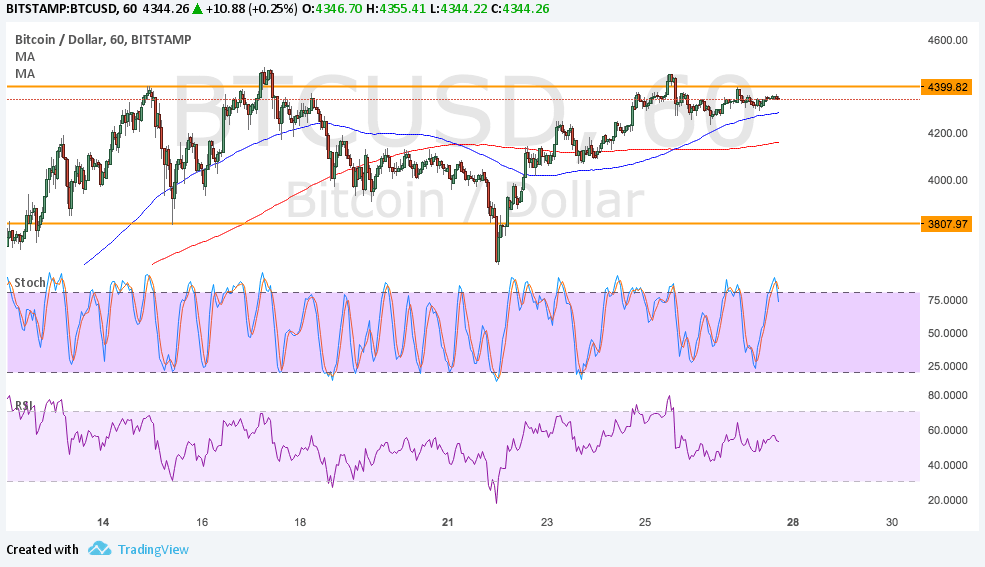
- If the ceiling holds, bitcoin price could tumble back to the bottom of its range around $3800.
- Technical indicators are giving mixed signals as to whether bulls or bears will gain the upper hand from here.
Bitcoin price is testing the top of its range, possibly waiting for more catalysts to determine if a bounce or break is in order.
Technical Indicators Signals
The 100 SMA is above the longer-term 200 SMA so the path of least resistance is to the upside. The gap between the moving averages is widening to reflect stronger buying pressure. These moving averages are also around the middle of the range, adding potential support around $4200 in the event of a pullback.
Stochastic is indicating overbought conditions, which means that buyers need to take a break and might let sellers step in. If so, bearish pressure could take bitcoin price to the range support or lower. RSI is also turning lower to show that sellers could be in control. An upside break, on the other hand, could lead to the formation of new record highs closer to $4500 or $5000.

Market Factors
Bitcoin price recovered from its recent selloff spurred by the pickup in mining power for Bitcoin cash. However, the activation of SegWit seemed to go by without a hitch, reviving demand for the original core version.
Also, the dollar is under pressure after traders saw weaker odds of a Fed rate hike in September during Yellen’s testimony in Jackson Hole. The Chairperson expressed concerns about weak inflation, possibly delaying their tightening decision and also the balance sheet runoff.
Looking ahead, the NFP release on Friday could be the main catalyst for dollar movement as this would be the last jobs report before the FOMC September meeting. Stronger than expected data could be bullish for the currency and force BTCUSD to retreat to the bottom of its range or at least halfway through.