Bitcoin Price Key Highlights
- Bitcoin price recently broke below a short-term support area visible on the 1-hour time frame.
- Price found support around the $565 area before showing signs of pulling back.
- Bitcoin is now approaching the former support zone around $575, which might now hold as resistance.
Bitcoin price is trending lower but is making a correction to an area of interest before resuming the selloff.
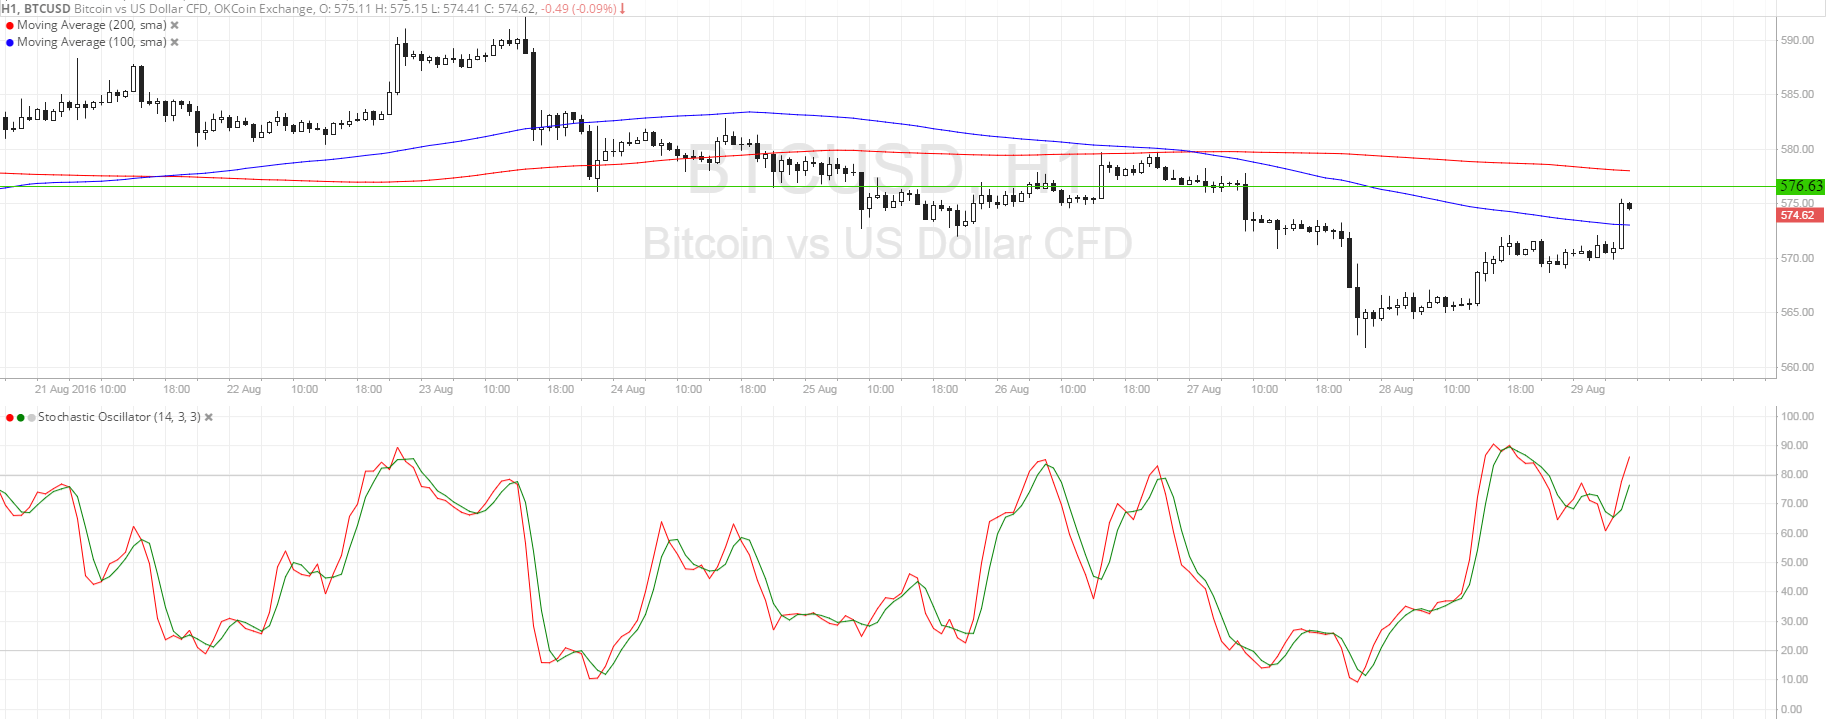
Technical Indicators Signals
The 100 SMA is below the 200 SMA so the path of least resistance is to the downside, which means that the downtrend could carry on. The 100 SMA is being tested at the moment but a higher pullback could last until the 200 SMA dynamic resistance, which is just slightly above the area of interest.
Stochastic is pointing up but is already heading down from the overbought zone, also suggesting that sellers are taking control of bitcoin price action. In that case, price could make its way back to the previous lows at $565 or lower.
On the other hand, a break past the area of interest at $575 or the 200 SMA could signal that bulls are putting up a strong fight, likely allowing the longer-term climb to resume.

Market Events
Dollar strength has been particularly evident in other financial markets last Friday, as Fed Chairperson Janet Yellen gave a hawkish testimony that increased the odds for a rate hike before the end of the year. This led traders to move funds to the dollar in anticipation of higher returns and also on risk-off flows, speculating that higher borrowing costs would dampen business investment and consumer spending.
However, this wasn’t the case for bitcoin price action, as the cryptocurrency seemed to bank on the risk-off moves as well. Declines in equities and commodities may have encouraged investors to seek higher returns in alternative assets such as bitcoin. Apart from that, news of a hack in the ethereum network may have propped up the value of bitcoin in the cryptocurrency sphere.
Charts from SimpleFX