Bitcoin Price Key Highlights
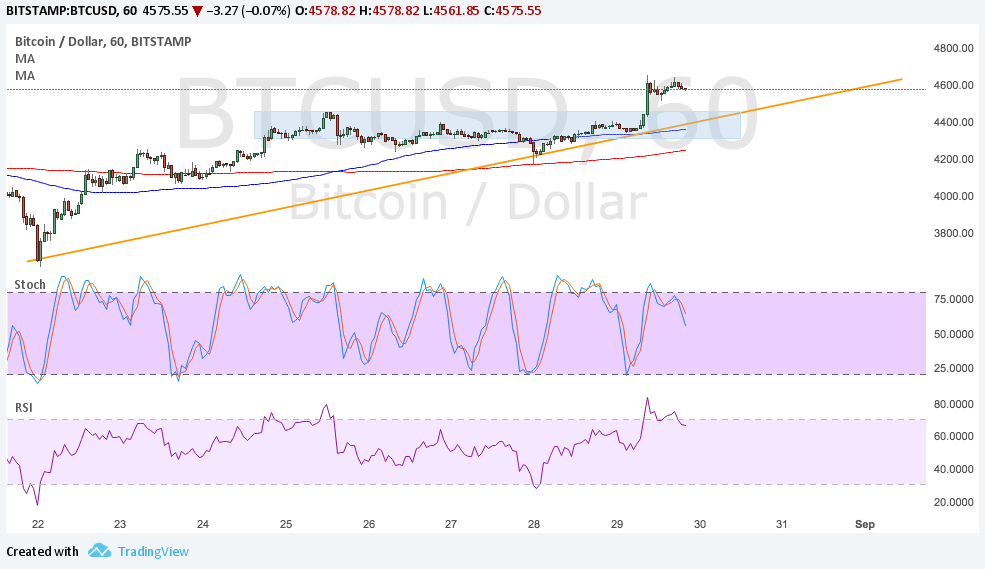
- Bitcoin price recently surged to new all-time highs after a brief period of consolidation at the top of its range resistance.
- Price is stalling around $4600 so bulls might need more energy before resuming the climb.
- A pullback to the rising trend line and nearby area of interest could be enough to draw more buyers to the game.
Bitcoin price is exhibiting more bullish momentum but could use a quick pullback before going on another leg higher.
Technical Indicators Signals
The 100 SMA is above the longer-term 200 SMA so the path of least resistance is to the upside, which means that the rally is more likely to resume than to reverse. The short-term moving average is in line with the ascending trend line connecting the latest lows of bitcoin price action.
This also coincides with the area of interest or former resistance at the $4400 area. A larger pullback could last until the 200 SMA dynamic support near $4200, but a break below this area could spur more declines.
Stochastic is turning down from the overbought area so bitcoin price might follow suit as this indicates a pickup in selling pressure. A bit of bearish divergence can be seen since the oscillator made lower highs while price had higher highs. RSI is also on the move down to show the presence of bearish pressure.
A move below the rising trend line support could put bitcoin price on track towards testing the longer-term range support at $3800-4000. On the other hand, a break past the recent highs could trigger a climb to the $5000 major psychological barrier.

Market Factors
The rise in geopolitical tension between the US and North Korea has led to a boost in bitcoin price as cryptocurrencies are usually in demand in these scenarios. Traders typically move their funds out of traditional markets like stocks and commodities while seeking higher returns in alternative assets.
Meanwhile, the dollar is also under pressure on weak NFP expectations as this could completely douse hopes of another Fed interest rate hike later this year. On the other hand, an upbeat reading could boost dollar demand against bitcoin.