Bitcoin Price Key Highlights
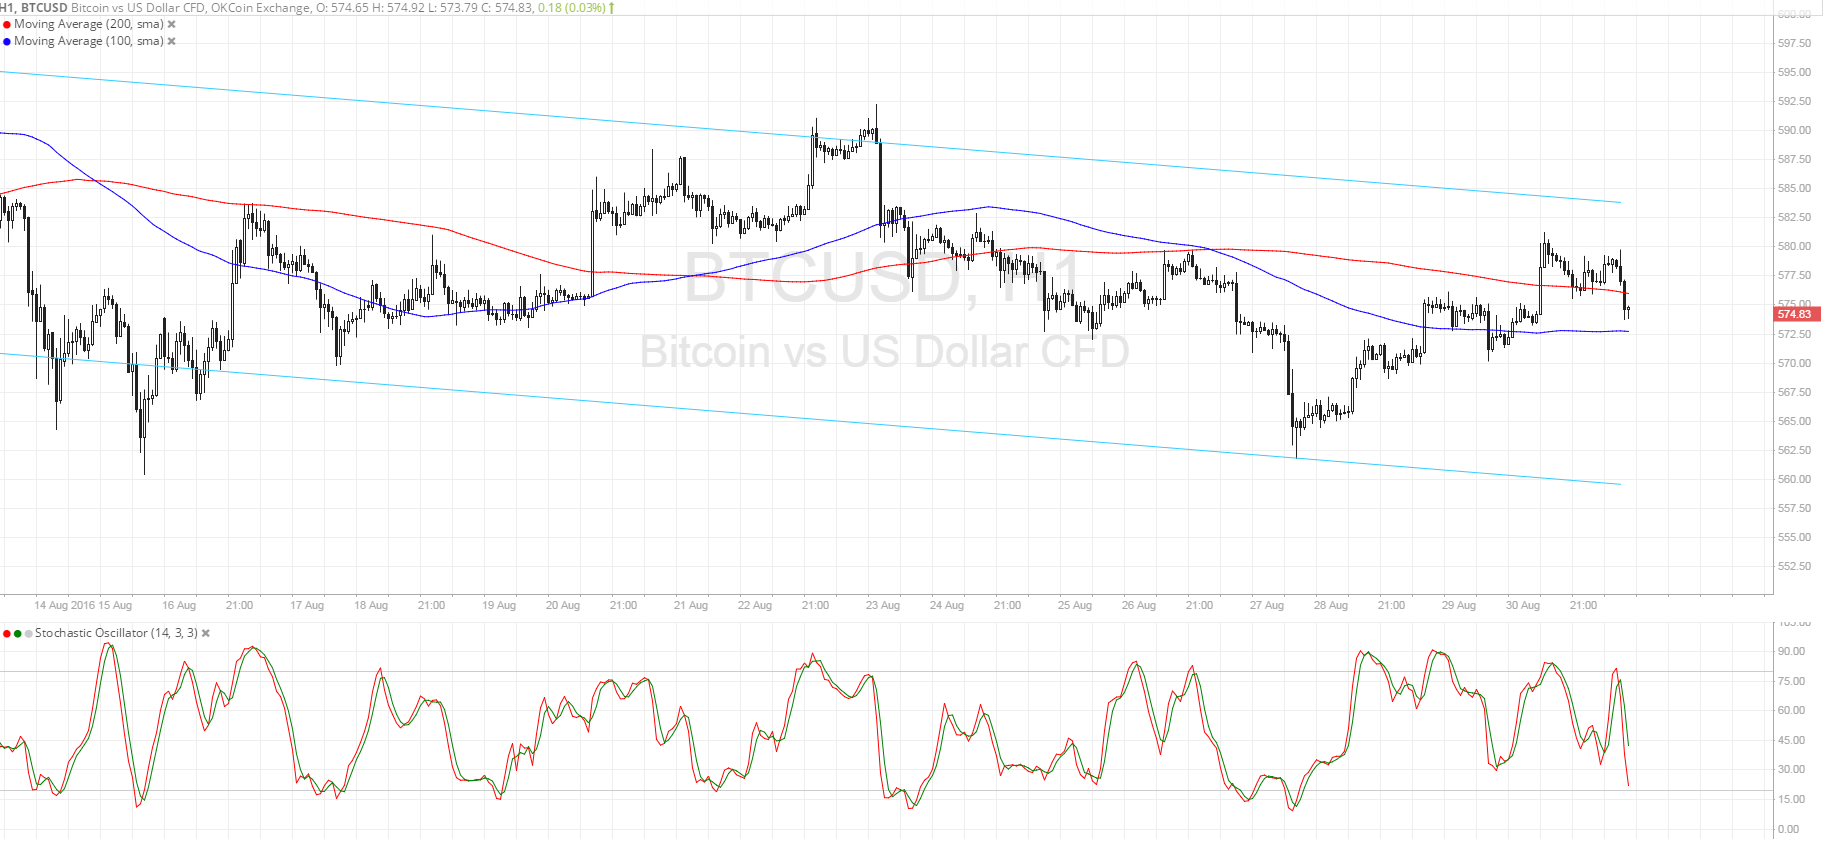
- Bitcoin price is still trending lower on its short-term time frames, moving inside a descending channel on its 1-hour chart.
- Price is on a climb but might be due for a selloff soon since it is already near the ceiling at the channel resistance.
- A short-term double-top can be seen, also suggesting a reversal from the recent rally.
Bitcoin price could be ready to resume its selloff upon testing the descending channel resistance visible on its short-term charts.
Technical Indicators Signals
The 100 SMA is below the 200 SMA on this time frame, which means that the path of least resistance in the short-term is to the downside. Bitcoin price is currently testing the resistance at the 200 SMA dynamic inflection point, which might already be enough to bring bearish momentum back. The next resistance is located just below $585.
Stochastic is heading south so sellers are already starting to regain control of bitcoin price action. A bearish divergence can also be seen as price made higher highs since August 28 while stochastic had lower highs then, also suggesting a return in bearish pressure. However, if bulls keep up the fight, bitcoin price could still have a shot at breaking past the channel resistance and making a reversal from the recent slide.

Market Events
The dollar seems to be asserting its dominance against bitcoin for now, as upbeat economic data from the US underscored expectations of a Fed rate hike in September or December. Apart from that, weaker commodity prices have also taken its toll on risk appetite, dragging the higher-yielding bitcoin lower in the process.
For today, the US ADP non-farm employment change report is up for release and a 174K gain in hiring is expected for the month of August, slower than the earlier 179K increase. Still, a higher than expected gain could spur more dollar gains and a selloff in BTCUSD as traders position for an upside NFP surprise later on in the week.
Charts from SimpleFX