Bitcoin Price Key Highlights
- Bitcoin price continues to tread higher, setting its sights on the top of the ascending channel on its 4-hour time frame.
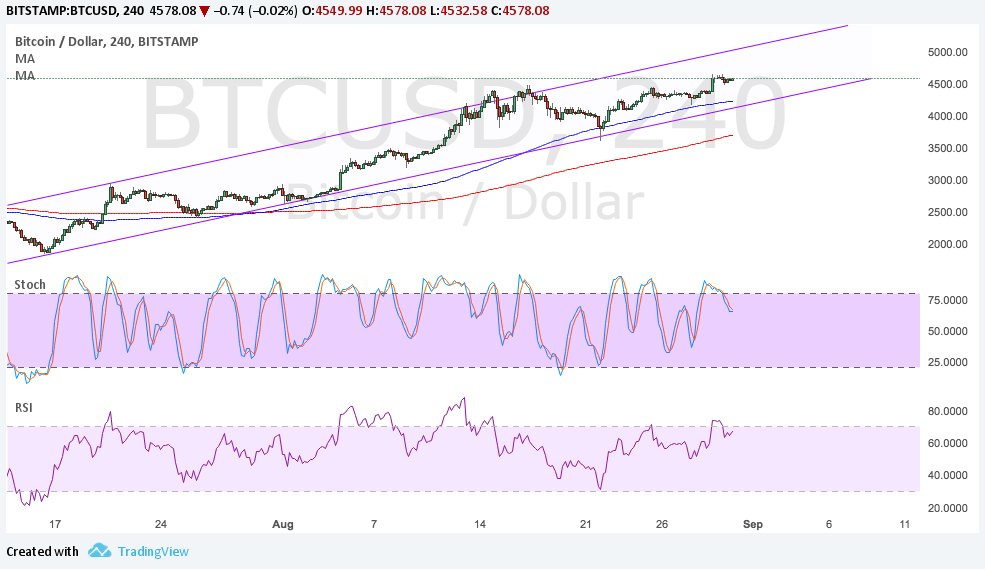
- Price is currently testing the mid-channel area of interest and a break higher could put it on track towards climbing to $5000.
- Technical indicators are giving mixed signals at the moment.
Bitcoin price could be aiming for the top of its ascending channel but a couple of technical indicators are hinting at a potential pullback.
Technical Indicators
The 100 SMA is above the longer-term 200 SMA so the path of least resistance is to the upside. This means that the uptrend is more likely to continue than to reverse. Also, the gap between the moving averages is widening to reflect stronger bullish momentum.
However, stochastic is starting to head south from the overbought region to indicate a pickup in selling pressure while buyers are taking a break. RSI is also turning lower after reaching overbought levels, also suggesting that a dip is possible.
The 100 SMA is close to the channel support around $4200, adding to its strength as a floor when tested. A larger pullback could last until the 200 SMA dynamic support around $3800.

Market Factors
Rising geopolitical tensions stemming from North Korea’s missile launch earlier this week boosted bitcoin price to fresh highs, but easing concerns are causing the cryptocurrency to retreat. Also, the fall in bitcoin cash price has drawn investor interest back to the original version.
Looking ahead, BTCUSD movement could also be influenced by rising dollar demand now that the Q2 GDP was upgraded to 3.0% and US President Trump started turning more attention towards tax reform.
For now, the projected impact of Hurricane Harvey on economic performance could keep a lid on dollar rallies but an upbeat jobs report to be released on Friday could spur rate hike expectations and dollar gains. On the other hand, downbeat data could pave the way for new bitcoin price highs once more.