Bitcoin Price Key Highlights
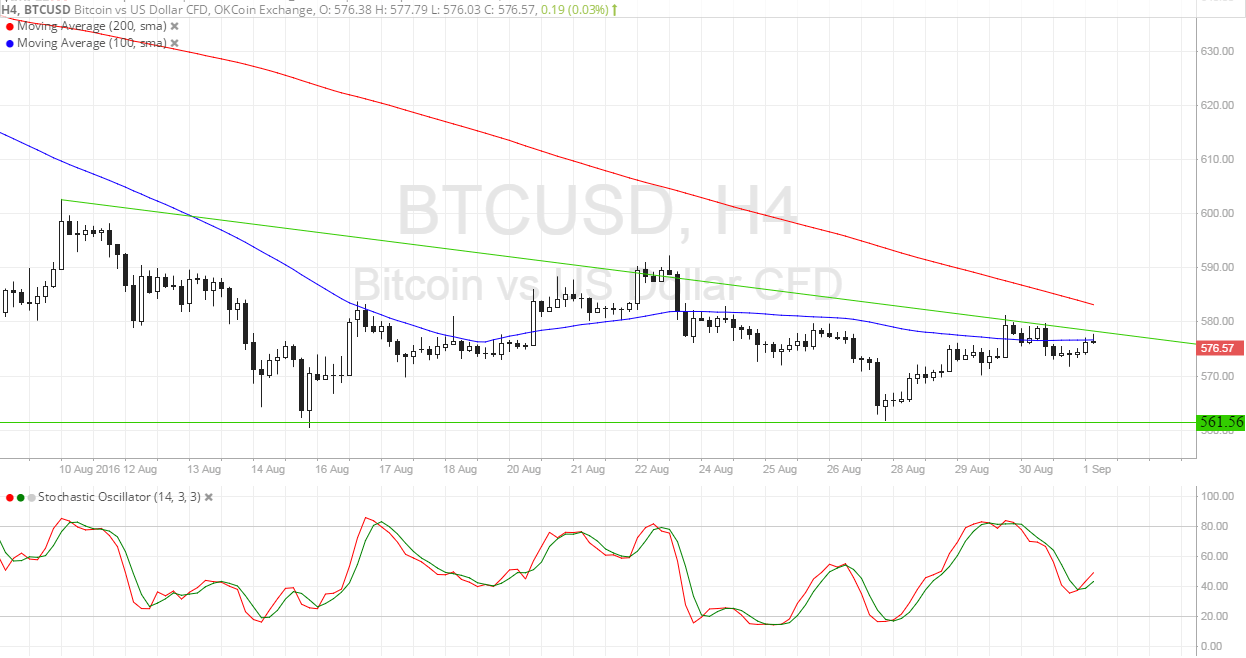
- Bitcoin price has been forming lower highs and finding support near $560, creating a descending triangle formation visible on its 4-hour chart.
- Price is back to the triangle resistance once more, still deciding whether to make a bounce or a break.
- Technical indicators are giving mixed signals so far, which means that direction could hinge on market catalysts.
Bitcoin price is hovering around the top of its descending triangle and the top-tier market catalysts could determine if it will hold as resistance.
Technical Indicators Signals
The 100 SMA is below the longer-term 200 SMA so the path of least resistance is to the downside. In addition, the 100 SMA is close to the top of the triangle, adding to its strength as a resistance area. A move higher could still find a ceiling at the 200 SMA dynamic inflection point.
However, the gap between the moving averages is narrowing so an upward crossover might be imminent. If that happens, buying pressure could pick up and spur an upside break from the triangle resistance around $580. From there, bitcoin price could be on track towards climbing to the triangle highs at $600.
Stochastic is on its way down but seems to be changing its mind midway, hinting that buyers are trying to take control of price action. This also supports the possibility of an upside breakout. On the other hand, if sellers regain control, price could head back to the bottom of the triangle near $560.

Market Events
Dollar traders are staying put for now, waiting for more clues on how the official jobs report might turn out as this would impact the odds of Fed tightening. So far, the ADP jobs data has shown positive momentum, which could yield an upside surprise for Friday’s NFP release. Analysts are expecting to see a 186K increase in hiring for August, lower than the earlier 255K gain.
For today, the ISM manufacturing PMI is due and a drop from 52.6 to 52.0 is eyed. Traders will be looking at the jobs component to gain a better idea of how the NFP might turn out, as a strong read could reinforce dollar rallies.
Charts from SimpleFX