Bitcoin Price Key Highlights
- Bitcoin price recently broke below the short-term rising channel bottom, signaling a pickup in bearish pressure.
- This could pave the way for a larger correction to the Fibonacci retracement levels on the daily chart.
- Technical indicators are suggesting that the longer-term rally could still resume at some point.
Bitcoin price made a sharp downside break of nearby support but still has plenty of potential floors to bounce from.
Technical Indicators Signals
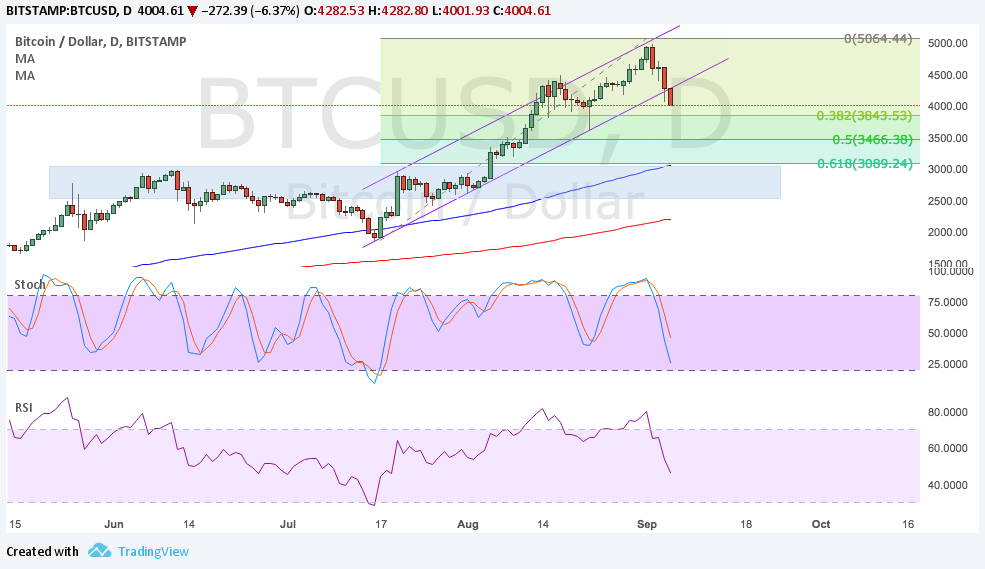
The 100 SMA is above the longer-term 200 SMA so the path of least resistance is to the upside, which means that the rally is more likely to resume than to reverse. The short-term moving average is close to the 61.8% Fibonacci retracement level around $3000, which is also in line with an area of interest or former resistance area.
A shallow pullback could find support at the 38.2% Fib or $3850 or the 50% Fib at $3460. A larger correction could last until the 200 SMA at $2000, but a break below this area could confirm that longer-term losses are in the cards.
Stochastic is heading south so bitcoin price might follow suit, but this oscillator is nearing oversold levels to indicate exhaustion among sellers. RSI is also on the move down to reflect the presence of bearish pressure and has room to go before hitting oversold levels.

Market Factors
A new ruling from Chinese regulators weighed heavily on bitcoin price even as the cryptocurrency has drawn investor support from rising geopolitical risks. Earlier this year, bitcoin traders have already been on edge about potential regulation from China as this could dampen activity in one of the largest cryptocurrency markets.
There were reports indicating that China banned ICO financing, which it clarified to be “activity of an entity raising virtual currencies, such as bitcoin or ethereum, through illegally selling and distributing tokens.”
Furthermore, the notice from the People’s Bank of China, the Central Network Office, the Ministry of Industry and Information Technology, the State Administration for Industry and Commerce, the China Banking Regulatory Commission stated that “persons or organizations who have completed ICOs shall refund the investors, protect the investors’ rights, and deal with the risks properly.”