Bitcoin Price Key Highlights
- Bitcoin price is still stuck in consolidation, as traders are waiting for bigger market catalysts before deciding which direction to take.
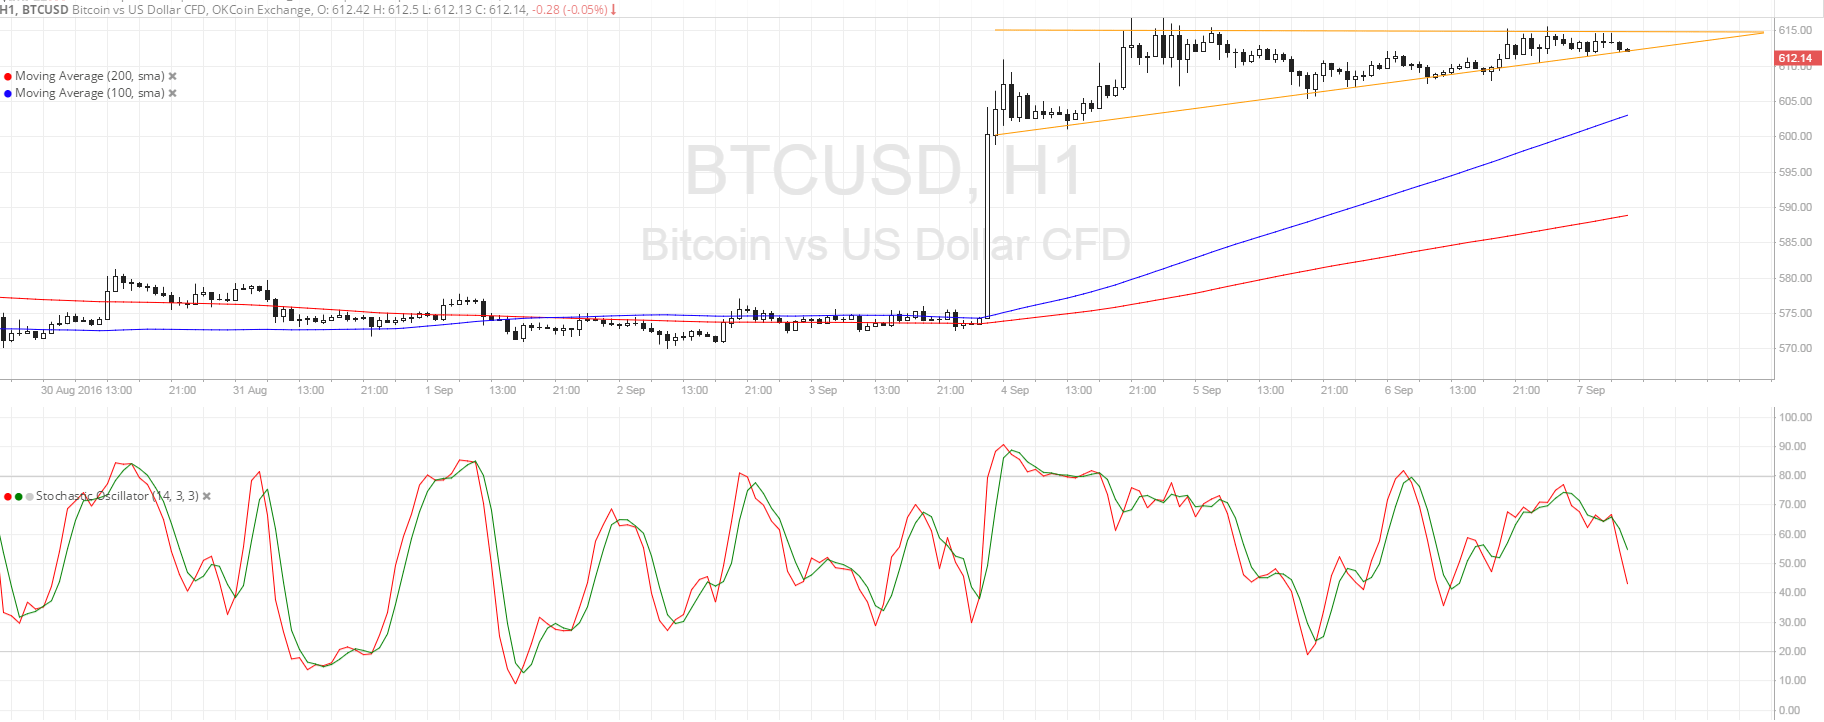
- Keep in mind that bitcoin just recently made a strong rally, which makes the consolidation pattern a bullish flag.
- Technical indicators seem to be suggesting that an upside breakout is likely.
Bitcoin price is still moving in tight consolidation, but this appears to be a continuation signal from the previous strong move.
Technical Indicators Signals
The 100 SMA is above the longer-term 200 SMA on this time frame, confirming that the path of least resistance is to the upside. In addition, the gap between the moving averages is still widening, which means that bullish pressure is strengthening.
Bitcoin price is approaching the peak of the consolidation pattern so a breakout is bound to take place sooner or later. A break lower could still find support at the 100 SMA or 200 SMA while an upside breakout could yield a climb of $25-30, which is the same height as the mast of the bullish flag pattern.
Stochastic is heading south so bitcoin price might follow suit. This indicates that bearish momentum is still in play, although buying pressure could return once the oscillator reaches the oversold zone.

Market Events
Economic data from the US turned out disappointing on Tuesday, preventing the dollar from making any headway against bitcoin price. The ISM non-manufacturing PMI was down from 55.5 to 51.4, lower than the estimated dip to 55.4 and indicative of a slowdown in industry growth.
Also, the Fed’s labor market conditions index slumped back to negative territory with a -0.7 reading from the earlier 1.3 figure, suggesting that conditions have worsened. Bear in mind that policymakers have emphasized that they’re looking for more signs of jobs growth before they decide to hike interest rates, which means that the odds of tightening are much lower now.
Up ahead, a couple of FOMC members are set to make speeches, possibly dropping clues on any change in policy bias. Also due today is the JOLTS job openings report, which might show further employment weakness and prop bitcoin up against the US dollar.
Charts from SimpleFX