Bitcoin Price Key Highlights
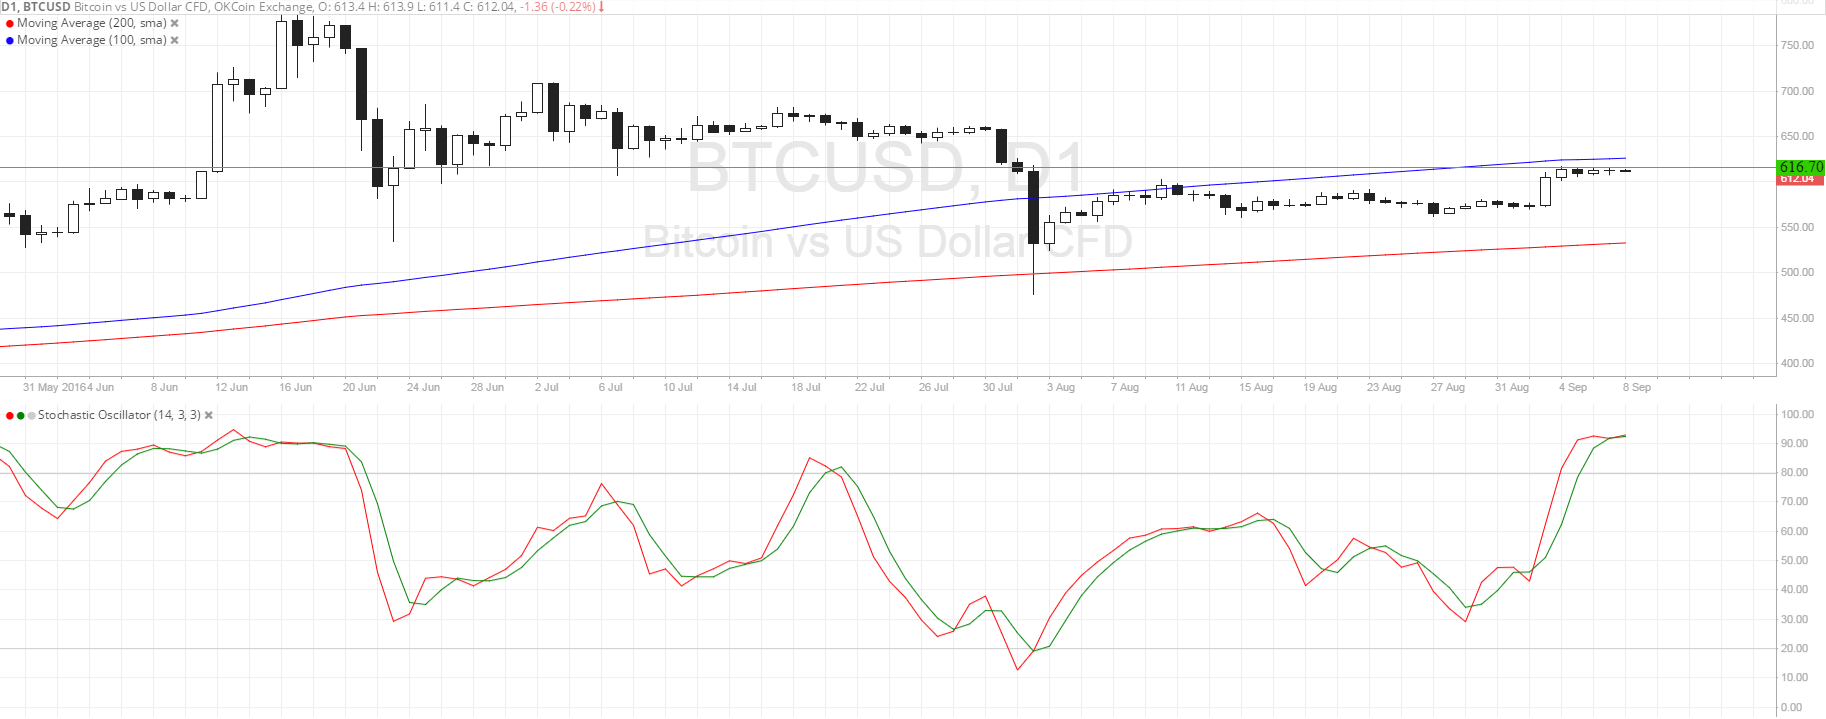
- Bitcoin price is still stuck in consolidation on its short-term time frames and looking at the daily chart shows why.
- Price is actually stalling below a former support zone around the $600-620 area, which might continue to hold as resistance.
- Price is also encountering a bit of a ceiling around its 100 SMA on the longer-term chart.
Bitcoin price is having trouble breaking past this area of interest visible on the daily time frame as technical indicators are giving mixed signals.
Technical Indicators Signals
The 100 SMA is above the longer-term 200 SMA on this time frame, indicating that the path of least resistance is still to the upside. This could mean that bitcoin price might have enough bullish momentum for a break above the long-term area of interest in order to resume its rally.
However, stochastic is already indicating overbought conditions so profit-taking could be in order. In that case, bitcoin price could retreat to the nearby support at $560-575 where it previously consolidated.
Still, the upside breakout from the short-term consolidation and the longer-term downtrend line connecting the highs since mid-June this year might be enough to ensure that buyers are in control of bitcoin price action, although the strength of the trend could hinge on market catalysts.

Market Events
Dollar traders still seem to be in limbo these days, as the odds of a Fed rate hike in September are looking slim but a couple of medium-tier reports have indicated that tightening might still be on the table for December. The Fed Beige Book noted that hiring and wage growth have been moderate, keeping spending and inflation supported in the coming months.
Still, market watchers can’t help but point out that the weakness in the ISM manufacturing and non-manufacturing PMI surveys might be enough cause for the Fed to stay on pause for the rest of the year. If so, bitcoin could take advantage of the unwinding of dollar longs and be an attractive buy opportunity for traders seeking higher risk.
Charts from SimpleFX