Bitcoin Price Key Highlights
- Bitcoin price failed in its last two attempts to break past the $4650 level, creating a double top or classic reversal pattern on the 1-hour chart.
- Price has yet to test the neckline at the $4500 mark and break below it to confirm that a selloff is in order.
- Technical indicators are showing mixed signals at the moment.
Bitcoin price is forming a small double top on its 1-hour time frame to signal a potential short-term selloff.
Technical Indicators Signals
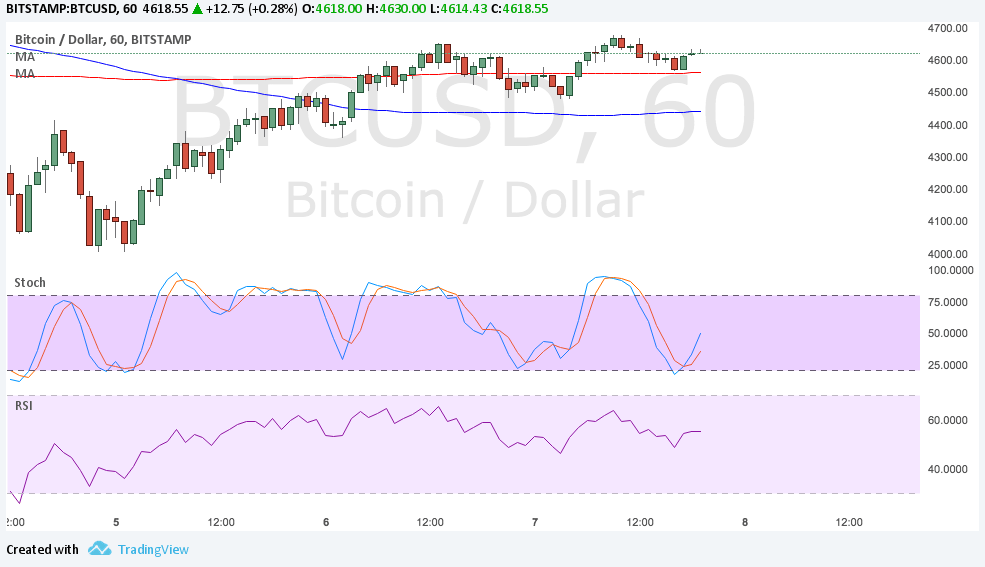
The 100 SMA is below the longer-term 200 SMA so the path of least resistance is to the downside. Price is trading above the 200 SMA dynamic inflection point, though, indicating that there’s still some bullish pressure in play.
Stochastic is also turning higher to signal a pickup in bullish momentum. This could be enough to push bitcoin price past the tops at $4650 and onto the record highs just above the $5000 handle. RSI, on the other hand, appears to be on its way down to show that selling pressure is in play.

Market Factors
Dollar demand has dipped once more as traders appear to be more focused on how Hurricanes Harvey and Irma would likely impact US growth prospects in the current quarter. Government officials continue to talk about tax reform and how it could be implemented before the end of the year in an effort to restore confidence in the economy but traders don’t seem to be buying it.
Investors still look wary about putting more funds in bitcoin as China’s ICO funding ban could likely limit trading volumes. This has also dampened volatility in bitcoin price, keeping it stuck inside the current range for the time being.
Looking ahead, FOMC testimonies could continue to impact dollar price action while risk appetite might push bitcoin price around. In particular, any updates from North Korea or another round of missile tests could bring geopolitical risk back on the radar and convince traders to buy up digital gold once more.