Bitcoin Price Key Highlights
- Bitcoin price made a sharp breakdown from its short-term consolidation last Friday.
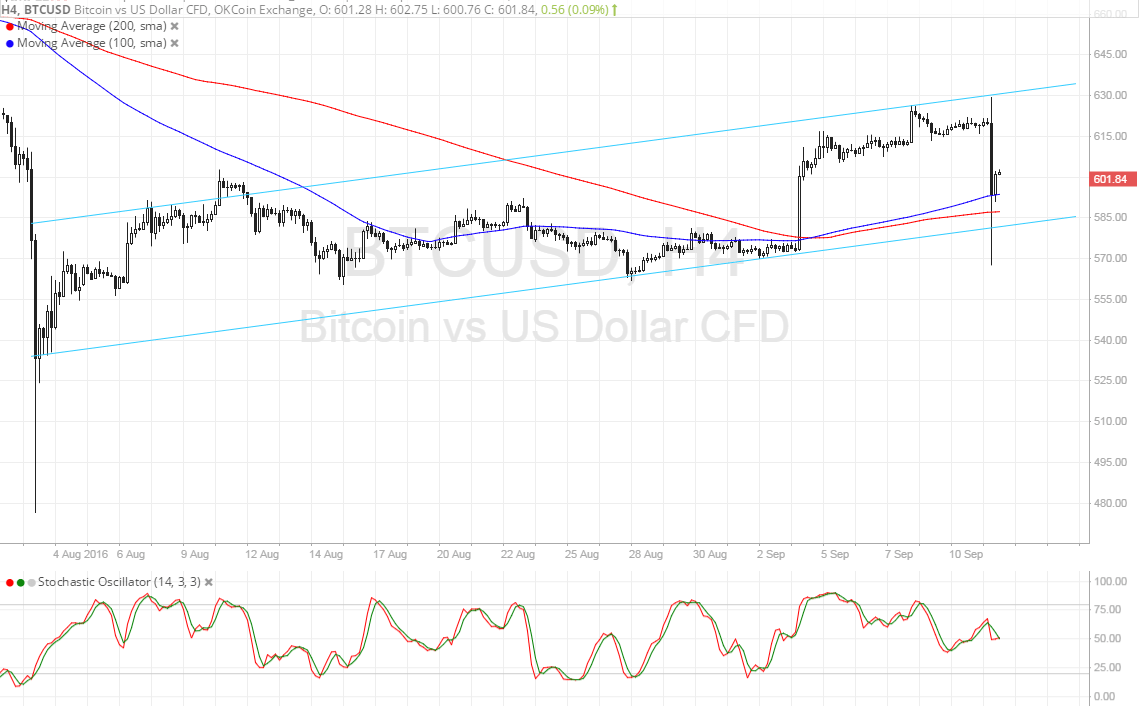
- Price seemed poised for more losses until it hit the bottom of the rising channel on the 4-hour time frame and made a quick bounce.
- Bitcoin could resume its climb from here, provided the channel support continues to keep losses in check.
Bitcoin price could be in for more gains from here as buyers popped up when it tested the rising channel support.
Technical Indicators Signals
The 100 SMA is still above the longer-term 200 SMA on the 4-hour chart, indicating that the path of least resistance is to the upside and that a rally is in the cards. These moving averages also held as dynamic support near the bottom of the rising channel at $575.
The gap between the moving averages is widening to show that bullish pressure is getting stronger. In that case, bitcoin price could make its way back up to the channel resistance at $630.
Stochastic seems to be on the move down, though, so sellers could still take control of bitcoin price action. If so, bitcoin could make another attempt to break below the channel support and trigger a reversal from the climb. A candle closing below the spike down to $570 could be enough to confirm a break lower.

Market Events
The US dollar reasserted its dominance as risk aversion clouded the financial markets towards the end of the previous week. There are a number of top-tier US reports due during the latter half of this week, possibly providing more clues as to whether the Fed can afford to tighten monetary policy in their upcoming interest rate decision or not.
For now it seems as though market watchers are still divided on the issue, which explains why the dollar has been unable to make much headway against bitcoin and cryptocurrency bulls prevented more declines from materializing. Other event risks for the week include the Bank of England policy decision and U.K. data as dovish remarks and weakening figures could bring Brexit jitters back to the table, thereby reinforcing the dollar’s safe-haven status against bitcoin.
Charts from SimpleFX