Bitcoin Price Key Highlights
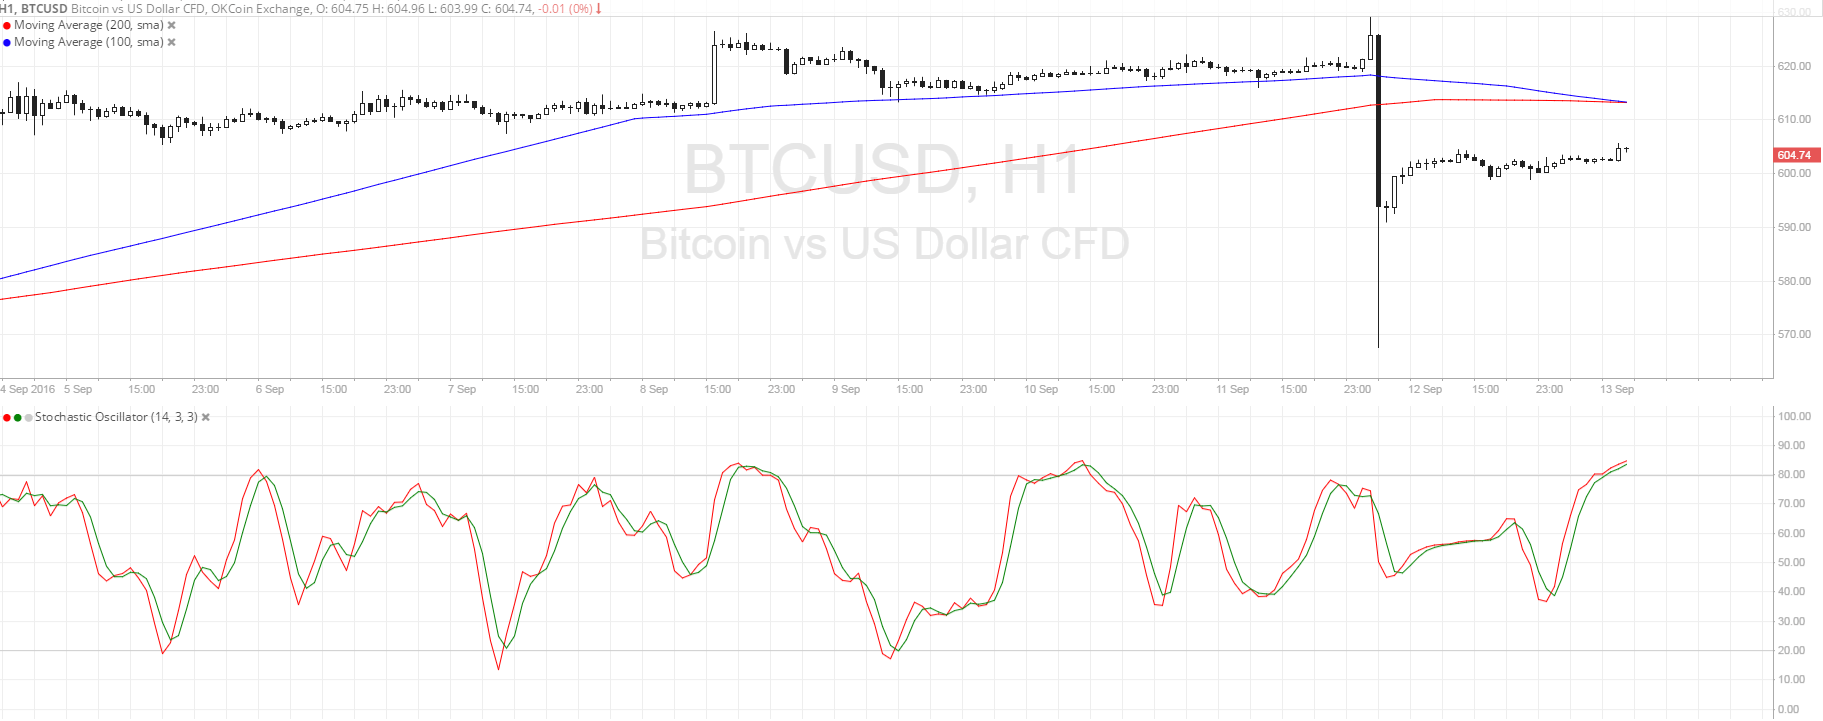
- Bitcoin price recently made a sharp selloff, breaking below a short-term floor around $620 and bouncing off the $570 area.
- Bearish momentum could still be in play, although a correction to the broken support seems imminent.
- Technical indicators are also suggesting that the selloff could resume at some point.
Bitcoin price is pulling up from its sharp drop but could encounter resistance at the nearby inflection points.
Technical Indicators Signals
The 100 SMA is starting to cross below the longer-term 200 SMA to show that the path of least resistance is to the downside. Meanwhile, stochastic is climbing but nearing the overbought zone, also to show that bearish momentum is building up.
Still, bitcoin price has room to pull up to the next resistance levels, which might be located around the moving averages’ dynamic inflection points around $615. If this area keeps gains in check, price could resume its drop to the previous lows, possibly when stochastic starts turning down from the overbought region as well.
However, if bitcoin price breaks past the moving averages and the downward crossover fails to materialize, bulls could take this as a chance to prop the cryptocurrency back up to the next ceiling at $625-630, depending on upcoming event risks.

Market Events
Dovish remarks from FOMC member Lael Brainard were seen as the primary reason for the dollar’s selloff in Monday’s trading sessions, as she emphasized the need for prudence before hiking. She noted that she’d rather wait for more evidence of consumer spending and inflation gains before voting to tighten.
Brainard also cautioned that the U.S. economy is exposed to external risks, particularly from China and emerging economies. She also mentioned potential threats from Europe and Japan, causing market watchers to ease up on their long dollar holdings to the benefit of bitcoin.
If this sentiment persists throughout the week, bitcoin price could continue to take advantage as more dollar bulls lighten up their holdings ahead of the FOMC decision later this month. Still, the upcoming CPI and retail sales reports on Friday could mean a great deal of volatility for bitcoin price.
Charts from SimpleFX