Bitcoin Price Key Highlights
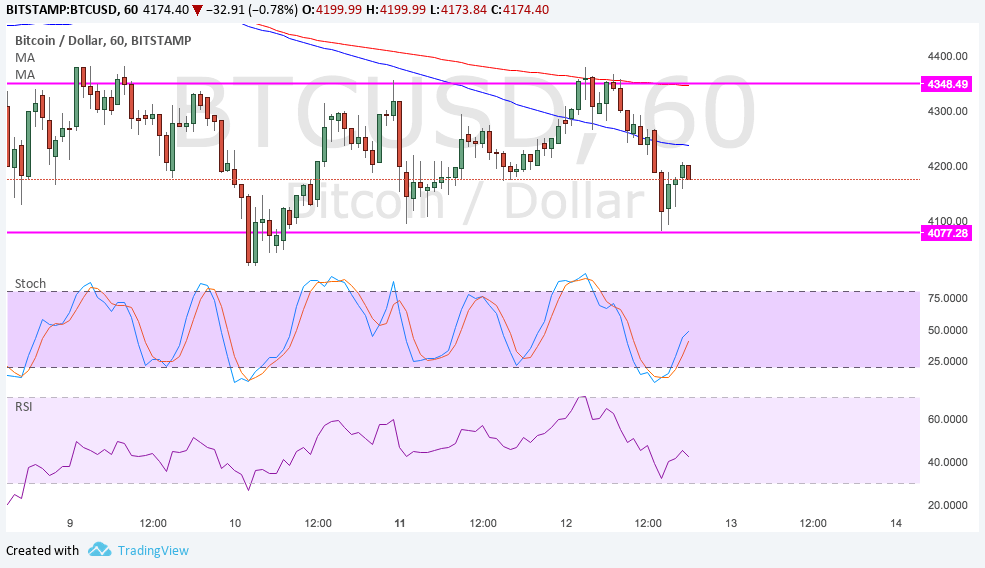
- Bitcoin price has been cruising sideways, moving between support around $4100 and resistance at $4350.
- Price appears to be bouncing off the floor once more and could be due for a move up to the ceiling again.
- Technical indicators are showing mixed signals while traders are waiting for more clues from market catalysts.
Bitcoin price has been moving sideways while opposing factors are in play and traders await more updates from China.
Technical Indicators Signals
The 100 SMA is below the longer-term 200 SMA so the path of least resistance is to the downside. This means that a move lower is more likely to happen than a break higher. In addition, the 200 SMA lines up with the range resistance, adding to its strength as a ceiling. The 100 SMA is around the middle of the range, possibly serving as a near-term barrier as well.
Stochastic is pulling up, though, suggesting that bullish momentum is poised to return. RSI is also heading north so bitcoin price might be able to follow suit. A break in either direction of the rectangle pattern could lead to a rally or selloff of around $250, which is the same height as the formation.

Market Factors
Easing geopolitical fears have kept a lid on bitcoin price gains as North Korea has yet to make its next move after being slapped with another round of sanctions. US President Trump had some harsh words to say once more and it’s hard to imagine that Pyongyang will take this sitting down.
Also, dollar demand has been supported so far this week, although analysts attribute this to mere short-covering after consecutive days in the red. Nonetheless, it’s hard to ignore the strong equity market rallies on talks of tax reform being backdated and implemented before the end of the year.
US PPI is up for release next and this should provide a clue on how the CPI readings might turn out on Friday. The consensus is for a rebound for both headline and core figures, possibly keeping Fed tightening expectations in play or at least a close vote among FOMC members in their next meeting.