Bitcoin Price Key Highlights
- Bitcoin price has been trending higher on its longer-term time frames, moving above a rising trend line visible on the daily chart.
- Price recently tested the trend line support and made a bounce, which suggests that bulls are intent on keeping the uptrend intact.
- The rally is still finding legs but there are technical arguments for a continuation of the climb.
Bitcoin price is still hovering close to the long-term rising trend line but could be trying to resume its rally.
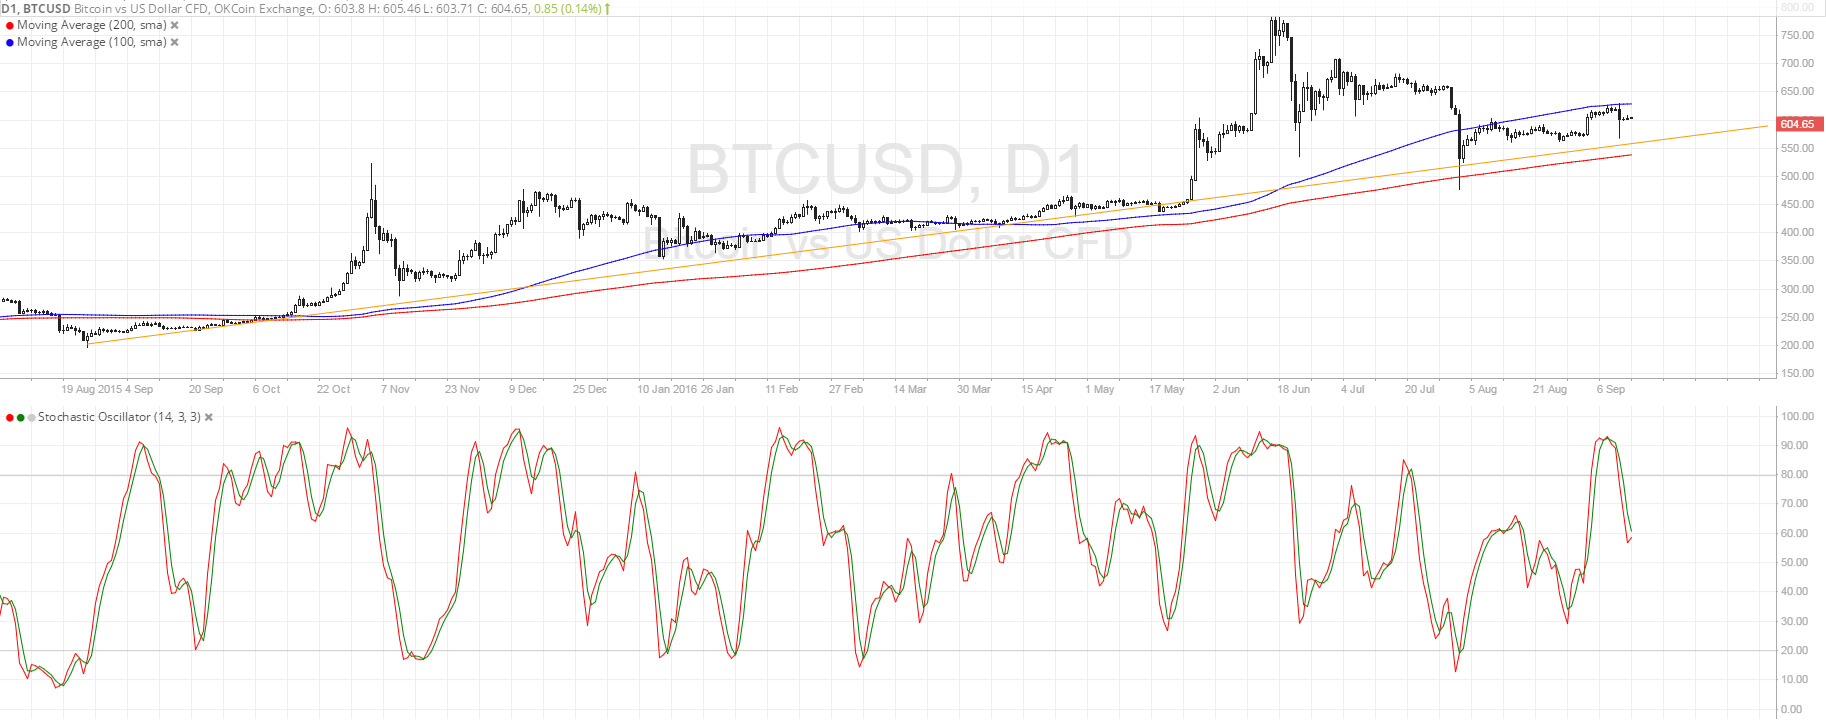
Technical Indicators Signals
The 100 SMA is above the longer-term 200 SMA on this time frame, indicating that the path of least resistance is to the upside. Also, the gap between the moving averages is widening and this reflects strengthening bullish pressure. The 200 SMA is close to the rising trend line support, adding to its strength as a floor and likely serving as the line in the sand for this uptrend.
For now, bitcoin price is finding near-term resistance at the 100 SMA and could be due for another test of support if this area keeps gains in check. Stochastic is on the move down to indicate that sellers are in control for now, but the oscillator is stalling on middle ground and might turn higher once more.

A bounce off the trend line could lead to a move up to the previous highs at $780, although it would take a strong market catalyst to trigger this action. Potential movers include the U.S. CPI and retail sales reports due later this week ahead of the FOMC decision next week.
On the other hand, a break below the trend line support around $550 could lead to a long-term selloff for bitcoin price. Again, this would require a major market catalyst, possibly upbeat U.S. data that might convince the Fed to hike interest rates next week or in December. Any shift to a more hawkish bias in their upcoming announcement could impact market sentiment and long-term dollar direction, which could then affect bitcoin price.
Charts from SimpleFX