Bitcoin Price Key Highlights
- Bitcoin price has bounced off a long-term area of interest after its recent sharp drop, signaling that the uptrend could still resume.
- Applying the Fib extension tool on this major correction could indicate how high bulls could take bitcoin from here.
- Technical indicators on the daily time frame also suggest that the long-term climb could carry on.
Bitcoin price seems to have completed a large correction and is ready to resume its long-term uptrend.
Technical Indicators Signals
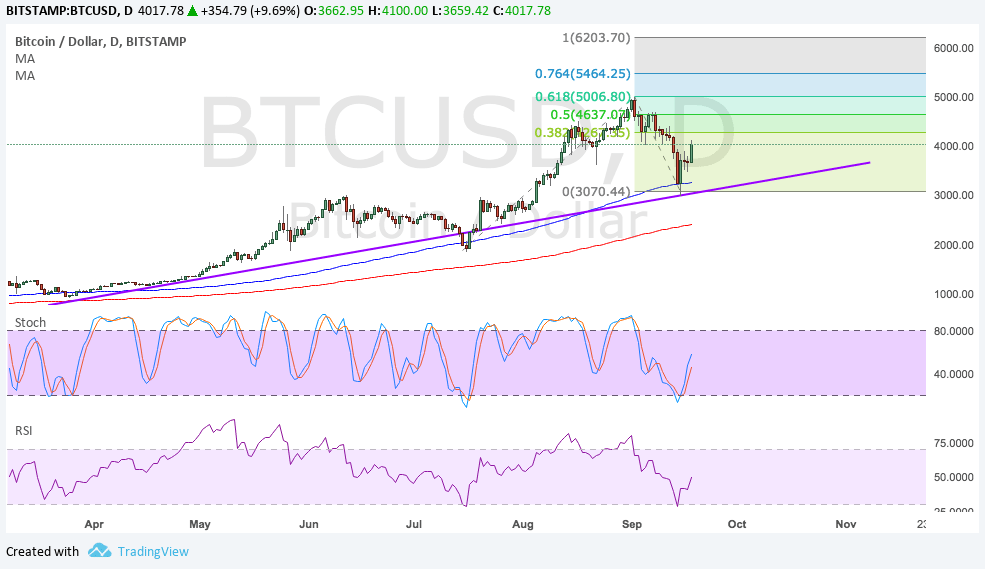
The 100 SMA is above the longer-term 200 SMA on the daily chart, signaling that the path of least resistance is to the upside. The gap is also gradually widening to reflect strengthening bullish momentum. Also, the 100 SMA has recently held as dynamic support as it lined up with the rising trend line connecting the lows since April.
Stochastic has pulled up from the oversold region to show that buyers are regaining control of bitcoin price action. RSI is also turning higher and appears to be heading north so bitcoin could follow suit.
The next potential resistance is at the 38.2% extension just past the $4000 major psychological barrier. The 50% extension is at $4637, the 61.8% extension at the $5000 handle close to the record highs, and the 76.4% extension at $5464. The full extension is around the $6200 level.

Market Factors
Chinese regulators have confirmed that they are stepping up their efforts to crack down on the cryptocurrency, following rumors that authorities are already shutting down exchanges in the country. However, investors seem to have moved on from this news as other markets like Japan and South Korea are taking majority of the market share and activity.
Meanwhile, the US dollar is giving up some ground to bitcoin price ahead of the FOMC decision, during which the central bank would likely keep rates on hold and downgrade growth forecasts on account of the recent hurricanes. A press conference will also follow and Yellen’s responses will be scrutinized as traders hunt for clues on December tightening.