Bitcoin Price Key Highlights
- Bitcoin price continues to tread carefully on account of lower volumes and trading activity in the past few days.
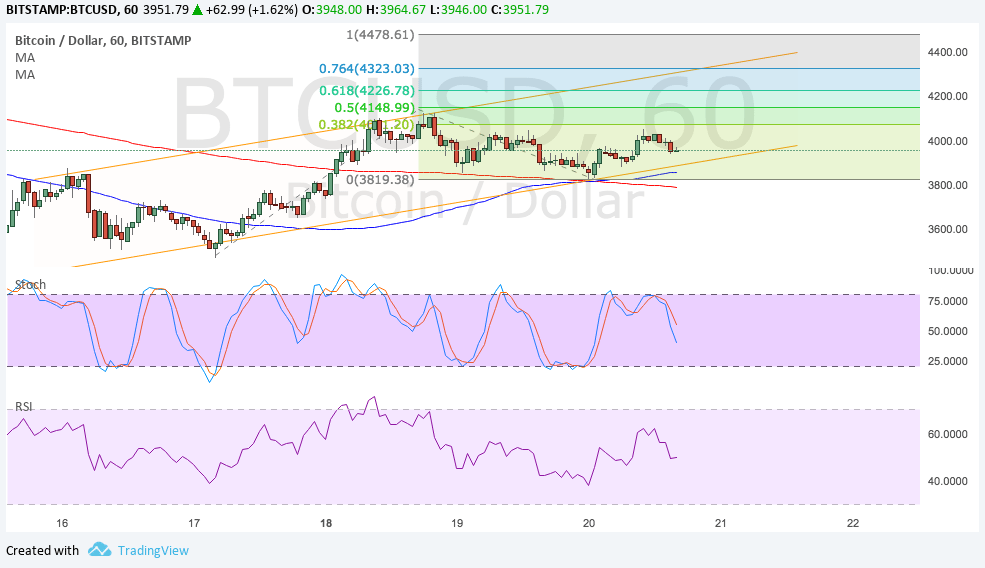
- Price is on an uptrend on the 1-hour chart, though, and an ascending channel can be seen connecting the latest lows and highs.
- Price is bouncing off support and could be due for a move to the next resistance levels as indicated by the Fibonacci extension tool.
Bitcoin price is slowly crawling higher and could make its way up to the next short-term resistance levels from here.
Technical Indicators Signals
The 100 SMA just crossed above the longer-term 200 SMA on this time frame, signaling that the path of least resistance is to the upside. In other words, the uptrend is more likely to resume than to reverse. The 100 SMA is also close to the ascending channel support, adding to its strength as a floor.
If it continues to keep losses in check, bitcoin price could head up to the next ceiling at the 38.2% extension at the swing high. Stronger bullish pressure could take it up to the channel resistance around the 50% to 61.8% levels or $4150-4225. Continued gains could make it up to the 76.4% level at $4323.03 or the full extension at $4478.61.
Stochastic is turning lower, though, which means that sellers are trying to regain control of bitcoin price action. RSI has been on the move up but is also pointing down again to signal that bears are eager to push bitcoin price back down.

Market Factors
The FOMC decision turned out positive for the dollar as the central bank confirmed that it would start unwinding its balance sheet next month and that a December interest rate hike is still in play. Fed head Yellen acknowledged that exports and business investment have picked up while admitting that the shortfall in inflation has been a mystery.
This seems to have had a limited effect on bitcoin price, though, as cryptocurrencies have been stablizing across the board. However, there have been rumors that bitcoin is due to split again in November, possibly creating a third version of the cryptocurrency.