Bitcoin Price Key Highlights
- Bitcoin price recently made a sharp break below a short-term consolidation pattern, which means that sellers have taken control.
- Price seems to have formed a bearish continuation signal as more sellers could take it down.
- Technical indicators are also confirming that selling pressure is mounting.
Bitcoin price looks ready continue is dive on a break of this bearish continuation pattern, with technicals signaling further declines.
Technical Indicators Signals
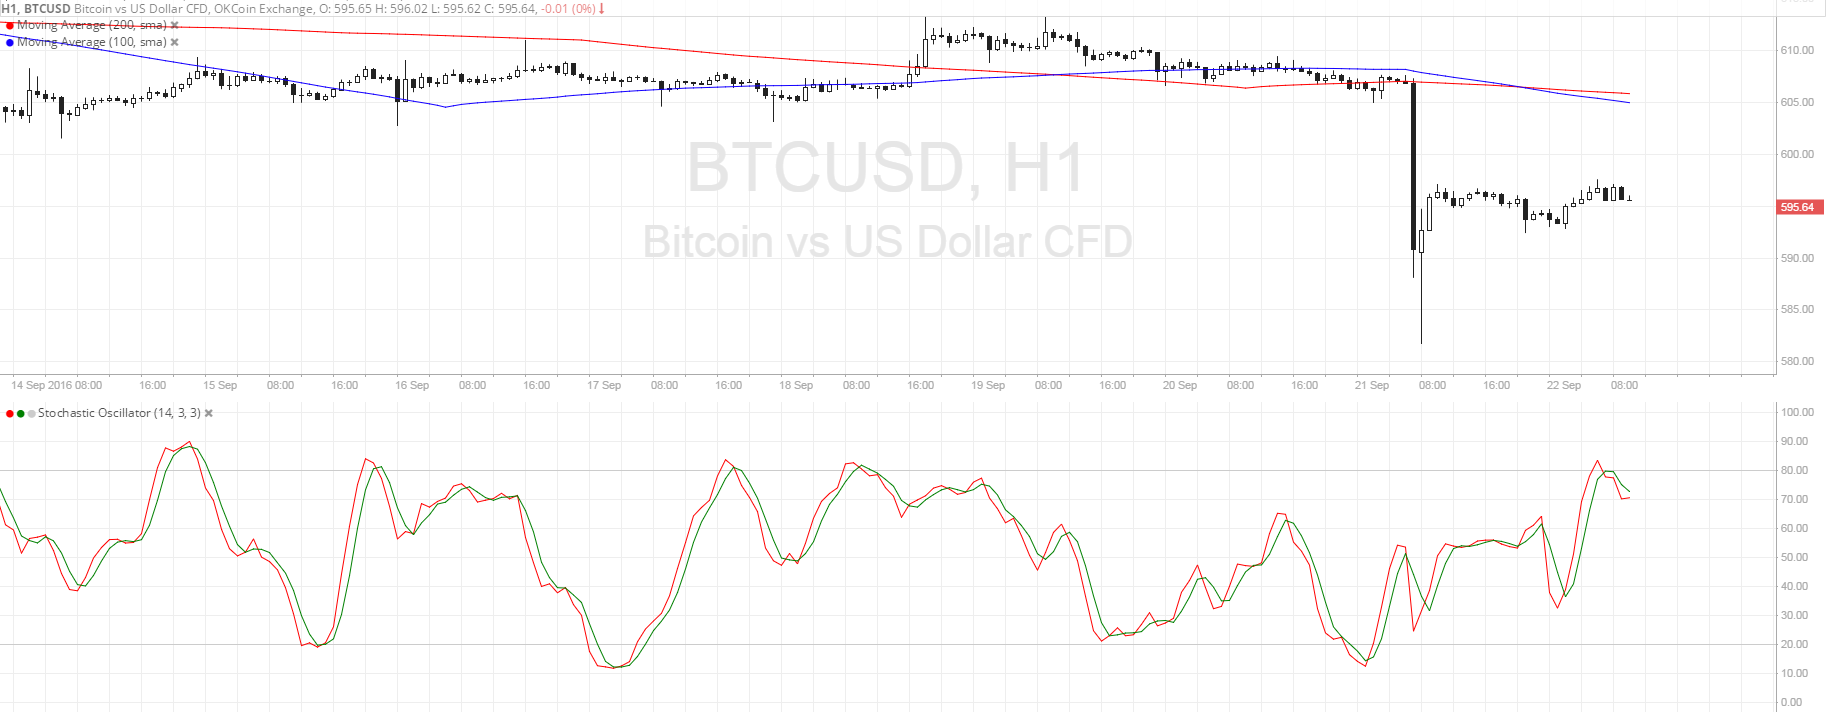
The 100 SMA is moving below the longer-term 200 SMA, confirming that the path of least resistance is to the downside. The crossover just took place but a widening gap between the moving averages could mean that bearish momentum would strengthen.
Meanwhile, stochastic is already turning down from the overbought zone to show that the quick correction from the drop is already over. Once the oscillator proceeds to head further south, bitcoin price could follow suit. Next downside target is around the spike lower to $583.
On the other hand, a continued correction from the drop could last until the dynamic resistance around the moving averages, which line up with the broken short-term support at $605. If bitcoin price continues to climb past area, bullish pressure could take over.

Market Events
Bitcoin price barely budged against the dollar after the highly-anticipated FOMC statement, as the decision to keep rates on hold was accompanied by hints about a rate hike later on in the year, perhaps in November or December. Three voting members called for tightening in this week’s decision but were outvoted by the other seven who wanted to stay put.
For now, the dollar could still strengthen against bitcoin price on these expectations of an interest rate hike before the end of the year, weighing on risk appetite and higher-yielding securities. Volatility has been lower in the bitcoin arena, which explains why a short position can easily move bitcoin price and entice more sellers to join the mix.
Charts from SimpleFX