Bitcoin Price Key Highlights
- Bitcoin price is still stuck in tight consolidation for now in what appears to be a bearish continuation pattern.
- Price is hovering safely above several support levels but another push lower could be due, given the recent trend.
- A change in market sentiment, however, could spur a bounce back to the near-term resistance.
Bitcoin price is stalling but appears to simply be pausing from its recent dive to gather more momentum.
Technical Indicators Signals
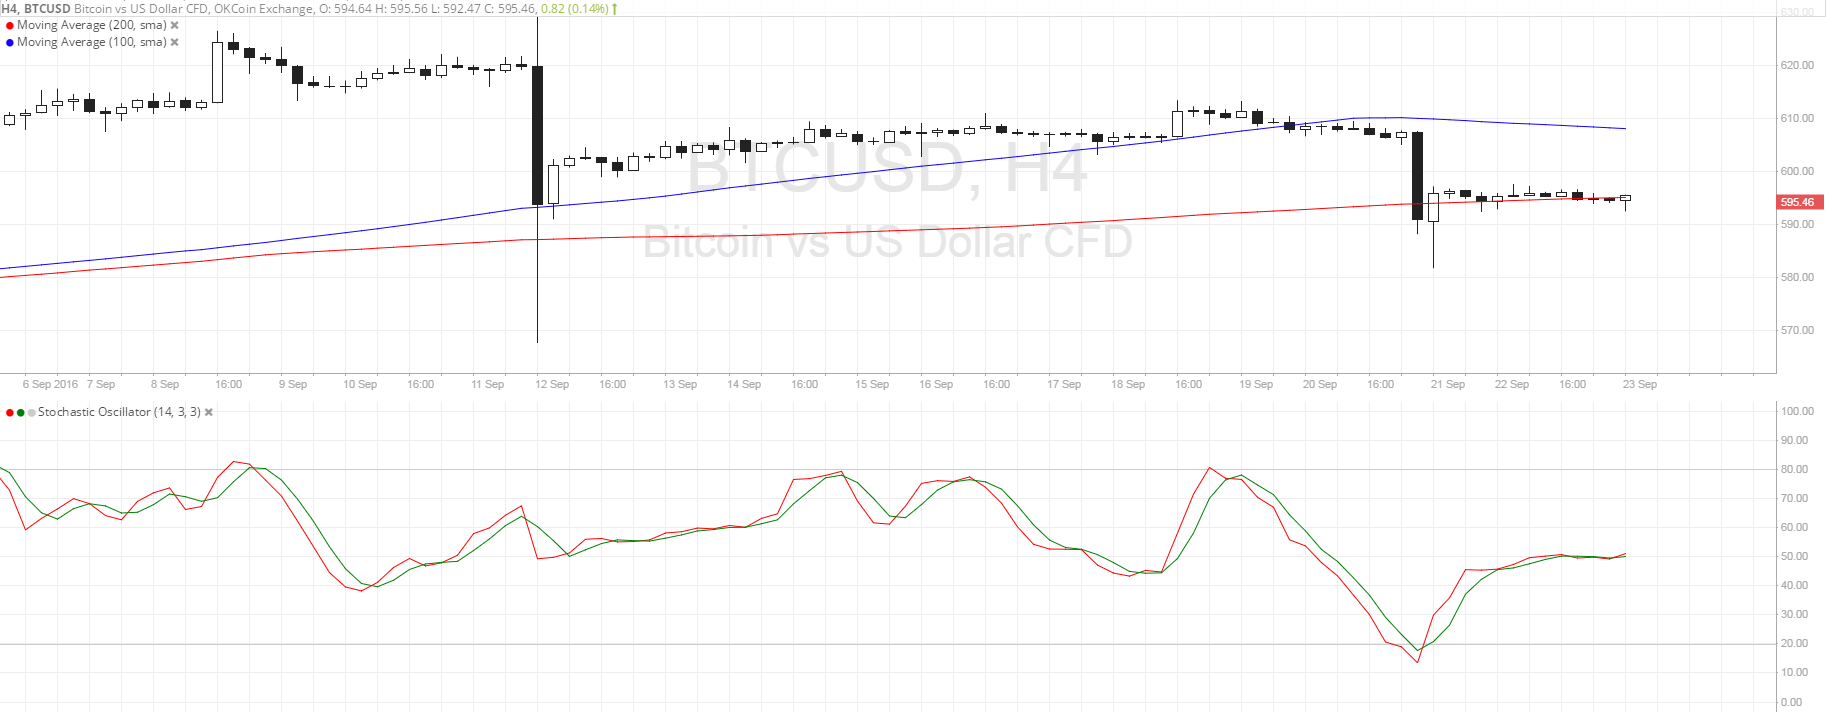
The 100 SMA is still above the longer-term 200 SMA on this time frame, suggesting that bulls could still push bitcoin price back up. After all, price is still finding support at the longer-term ascending channel bottom and the dynamic inflection point at the 200 SMA.
However, the gap between the moving averages seems to be narrowing so a downward crossover may be imminent. If it happens, more sellers could pile up their short positions and trigger a downside break from the $580-590 support zone, setting off a longer-term drop.
Stochastic is on middle ground at the moment, reflecting indecision among buyers and sellers. It’s worth noting that the oscillator is on its way up, though, hinting at a slight favor in bullish odds.

Market Events
Liquidity has slowed once more after the central bank events have passed, particularly the FOMC statement. The Fed decided to keep interest rates unchanged for the time being but left the door open for a December hike, which might be enough to keep the dollar stronger against bitcoin price in the next few months.
However, all this would be data-dependent so any disappointments in US reports could weaken tightening odds and draw traders away from the dollar and back to bitcoin. Keep in mind that a possible Fed rate hike not only influences dollar demand but also affects market sentiment, with tightening expectations likely keeping a lid on risk appetite and adding a drag on bitcoin price.
On the other hand, expectations that the Fed would keep borrowing costs at their low levels for the remainder of the year could keep risk-taking in play, encouraging traders to reduce their safe-haven dollar holdings and pursue higher returns in riskier assets like bitcoin.
Charts from SimpleFX