Bitcoin Price Key Highlights
- Bitcoin price has formed lower highs recently, suggesting that a short-term drop may be in the cards.
- Price is making a quick pullback from its recent drop, possibly to make a retest of the broken support at the 100 SMA.
- Price is still hovering around an area of interest at this point so it could be anyone’s game.
Bitcoin price just recently came off a quick drop and may be ready to resume its slide after this pullback.
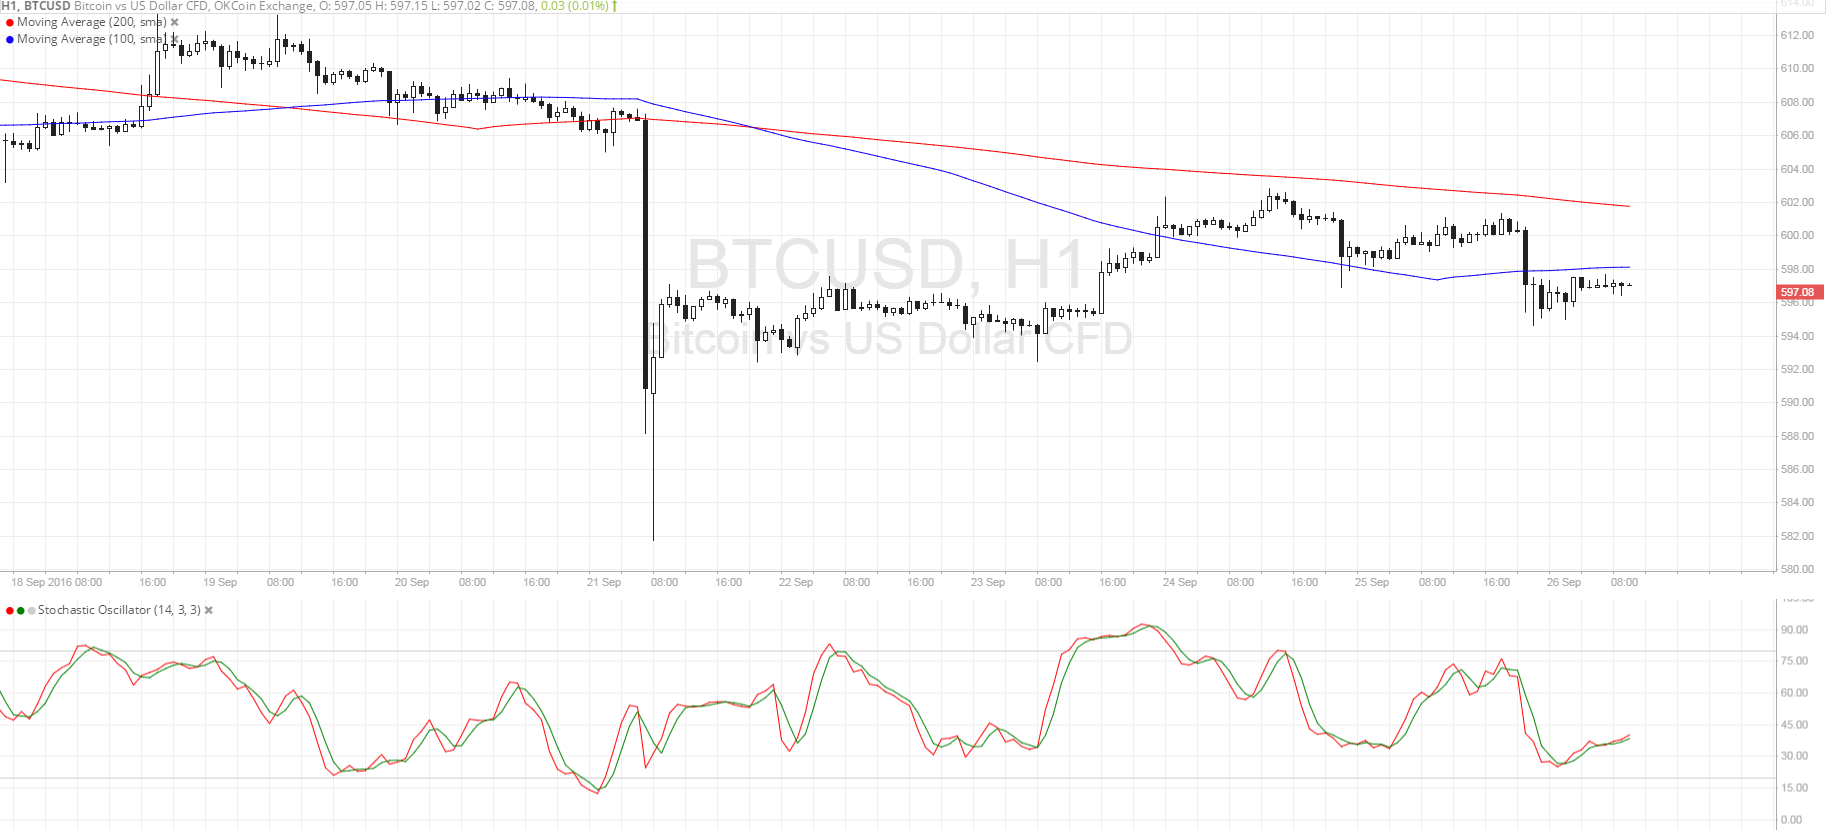
Technical Indicators Signals
The 100 SMA is still below the 200 SMA so the path of least resistance is to the downside. However, the gap between the moving averages is narrowing so an upward crossover might be due, signaling a change in trend.
For now, if the 100 SMA near $600 holds as resistance, bitcoin price can be able to resume its drop, possibly until the next near-term support at $590-592. A break below that area could lead to a test of the $585 mark.
Note, however, that stochastic is still moving up to suggest that buyers are in control of bitcoin price action for now. If this bullish pressure is strong enough, bitcoin could move up to the 200 SMA dynamic resistance around those highs at $602 next. A continued rally past that point could bring it up to the area of interest at $605 then at $615.

Market Events
This week could be a particularly volatile one for US markets, which could mean a lot of movement for bitcoin price against the dollar as well. FOMC policymakers have speeches scheduled throughout the week, possibly giving more clues on whether or not they can be able to tighten monetary policy before the end of the year.
Also, the presidential debates are coming up and these are likely to dwell on issues pertaining to the US economy. Apart from the plans of each candidate, markets could also have a huge reaction to the poll results following these debates, as any large swings in lead could strongly influence economic outlook and risk sentiment.
Charts from SimpleFX