Bitcoin Price Key Highlights
- Bitcoin price recently broke out of its triangle consolidation pattern on the 1-hour time frame to signal a direction.
- Price broke to the upside, which means that bulls are getting back in the game.
- Rising geopolitical risks are being considered the main catalyst for the upside break.
Bitcoin price made an upside break from its descending triangle resistance to reflect resurfacing demand on returning geopolitical risks.
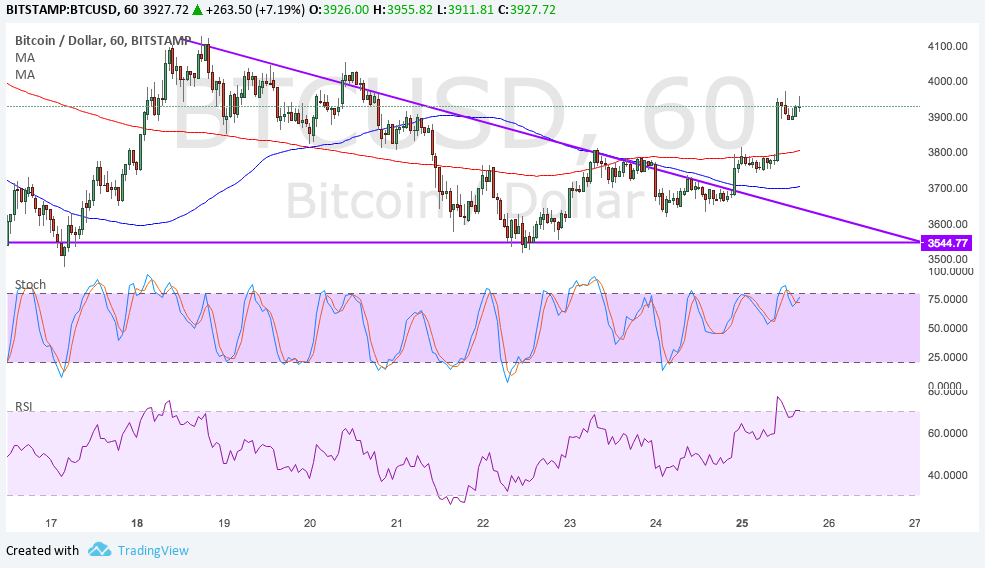
Technical Indicators Signals
The triangle chart pattern spans $3500 to $4100 so the resulting rally could last by $600 or the same height as the formation, taking bitcoin price to $4300 next. However, the 100 SMA is below the longer-term 200 SMA so the path of least resistance might still be to the downside.
Then again, bitcoin price was able to surge past the 200 SMA dynamic resistance so it might just be a matter of time before an upward crossover follows. A bit of bullish continuation signal can also be seen on the 1-hour time frame and a candle closing past the latest highs around $3950-70 could confirm that more gains are underway.
However, stochastic is already closing in on overbought territory to suggest that buyers might need to take a break soon. RSI is indicating overbought conditions and looks ready to turn lower, so bitcoin price might still pull back to the broken triangle resistance around $3700 before heading any higher.

Market Factors
In the latest turn of events, North Korea’s foreign minister claimed that the U.S. has declared war on the hermit nation after Trump’s recent tweets and remarks in the U.N. General Assembly. The official warned that they would shoot down U.S. bomber planes even if they’re not in North Korean airspace.
With that, geopolitical tension was escalated once more as many are now worried that it’s only a matter of time before either the U.S. or North Korea pulls the trigger. In these cases, digital gold or bitcoin tends to benefit as traders continue to seek higher returns but this time in alternative markets that might be less affected by these risks.