Bitcoin Price Key Highlights
- Bitcoin price is still treading sideways, moving above a resistance turned support level at $602.
- Price has formed lower highs on the 15-minute chart, suggesting that bullish pressure is weakening and that bears are trying to push for a move lower.
- For now, the area of interest is holding quite well since it lines up with the 100 SMA dynamic support.
Bitcoin price is hovering above a resistance turned support area visible on the short-term time frames, still deciding whether to make a bounce or a break.
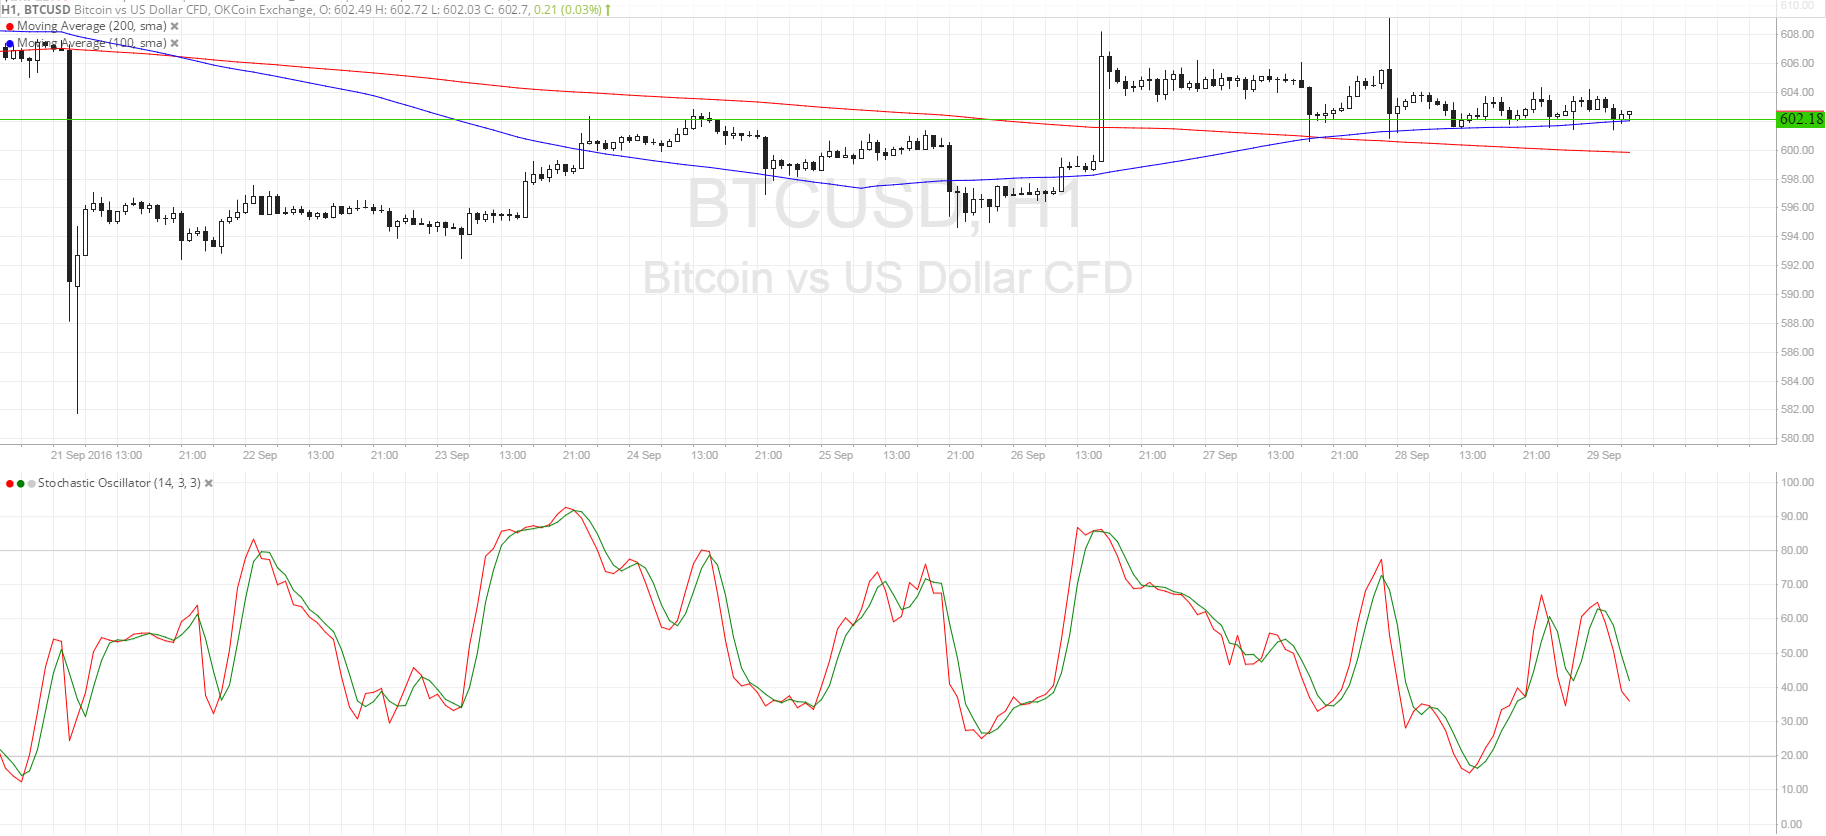
Technical Indicators Signals
The 100 SMA just recently crossed above the longer-term 200 SMA on this time frame, suggesting that the path of least resistance is to the upside. Also, the 100 SMA is holding as dynamic support and keeping losses in check, with the next potential floor at the 200 SMA just close by.
However, stochastic is pointing down to suggest that sellers are still in control of bitcoin price action for now. In that case, a downside break of this consolidation pattern could be in the cards, taking the cryptocurrency down to the next support at $595.
Stronger selling pressure could take bitcoin price to the spike lower to $582. On the other hand, a return in bullish momentum could take it up to the highs at $608 and beyond.

Market Events
Bitcoin price seems unfazed by the outcome of the OPEC meeting in Algiers, although the agreement among energy ministers seems to have spurred a return in risk appetite in other financial markets. Perhaps this indicates that investors are busy trading other assets such as equities and commodities, keeping a lid on liquidity in virtual currencies.
Still, this doesn’t discount the possibility of a strong move on profit-taking ahead of the end of the month and quarter by Friday or over the weekend. After all, this dip in liquidity does open the possibility for more volatile price action, with small positions likely to draw market attention and push bitcoin price in a strong direction, so stay on the lookout for that.
Charts from SimpleFX