Bitcoin Price Key Highlights
- Bitcoin price has been treading carefully inside a tight range visible on its short-term charts.
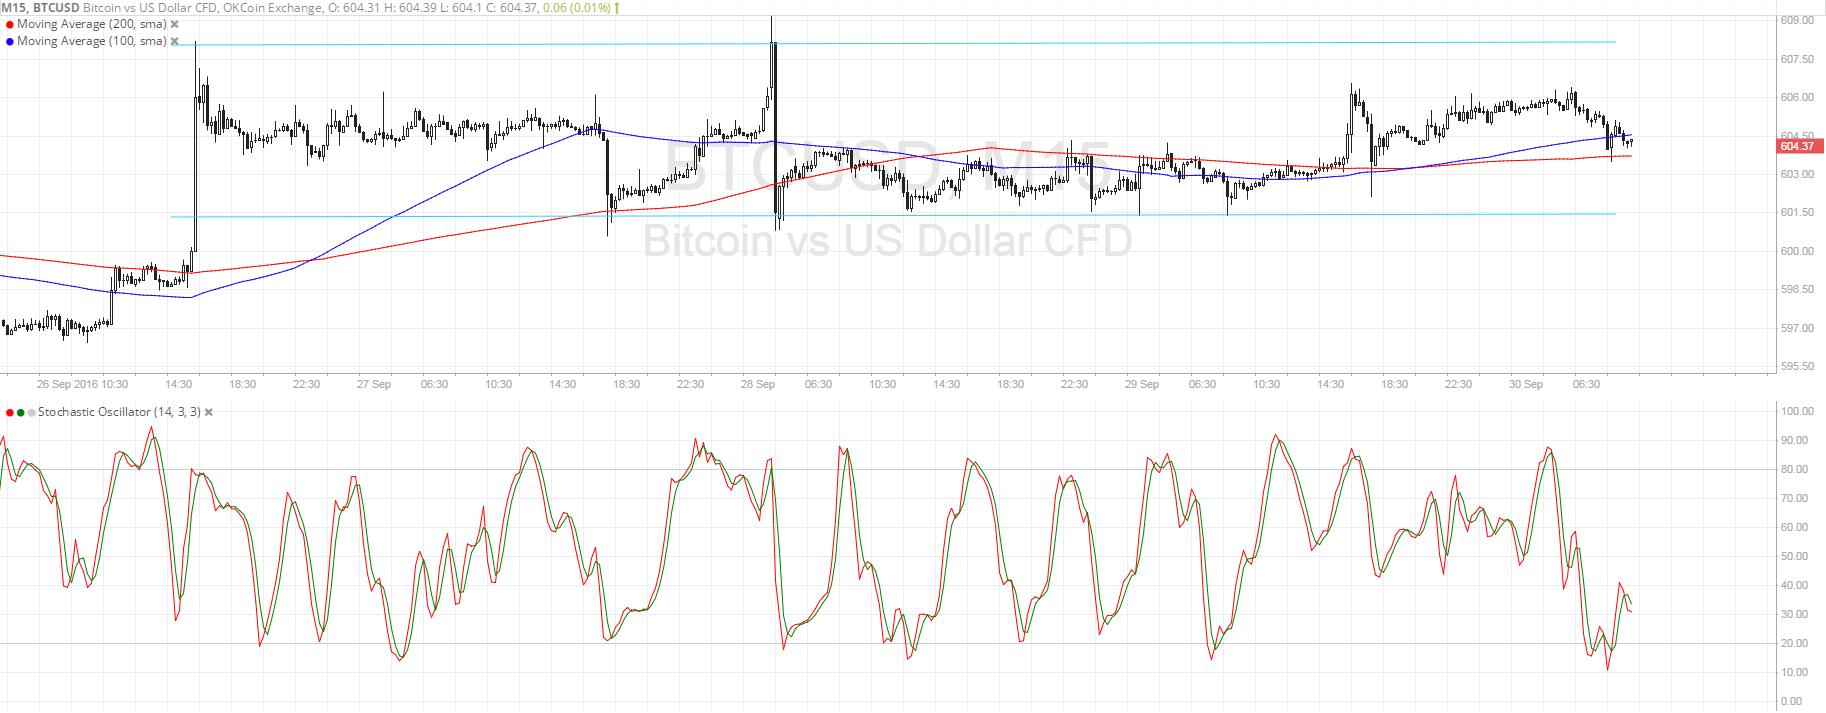
- Price seems to have lost bullish momentum and is headed for the bottom of the range at $601.50.
- Technical indicators are hinting that losses could be kept in check.
Bitcoin price could be due for another test of the short-term range support, with technical indicators supporting a bounce.
Technical Indicators Signals
The 100 SMA is above the longer-term 200 SMA on this time frame, hinting that the path of least resistance is still to the upside. In fact, bitcoin price has formed higher lows so bulls could be trying harder to keep it afloat. Apart from that, the 200 SMA is currently holding as dynamic support and the gap between the moving averages is widening to reflect stronger buying pressure.
Stochastic is on its way up from the oversold region, also suggesting that buyers are regaining control of bitcoin price action. In that case, another test of the resistance at $608 might even be possible in the near-term.
An upside break from the top of the range could inspire a longer-term rally, possibly leading to at least $6.50 in gains or the same height as the chart pattern. On the flip side, a downside break from support could yield $6.50 in losses for bitcoin price.

Market Events
Liquidity has been thin in the bitcoin arena, so much so that the Deutsche Bank fiasco wasn’t enough to spur strong moves. This indicates that investors may be focusing their attention on commodities and equities instead, as more updates have been sparking volatility in those markets.
Still, if the banking crisis does escalate, bitcoin price could stand to benefit if it is seen as an alternative asset of choice, particularly among European traders who are liquidating their stock and bond holdings. For now, though, German bonds are enjoying strong demand as there are signs of unease but investors aren’t exactly panicking just yet.
Do watch out for potential spikes on profit-taking at the end of the month and quarter, as well as reactions to the top-tier Chinese PMI releases over the weekend.
Charts from SimpleFX