Bitcoin Price Key Highlights
- Bitcoin price continues to trend higher, moving above an ascending trend line connecting the latest lows on the 1-hour time frame.
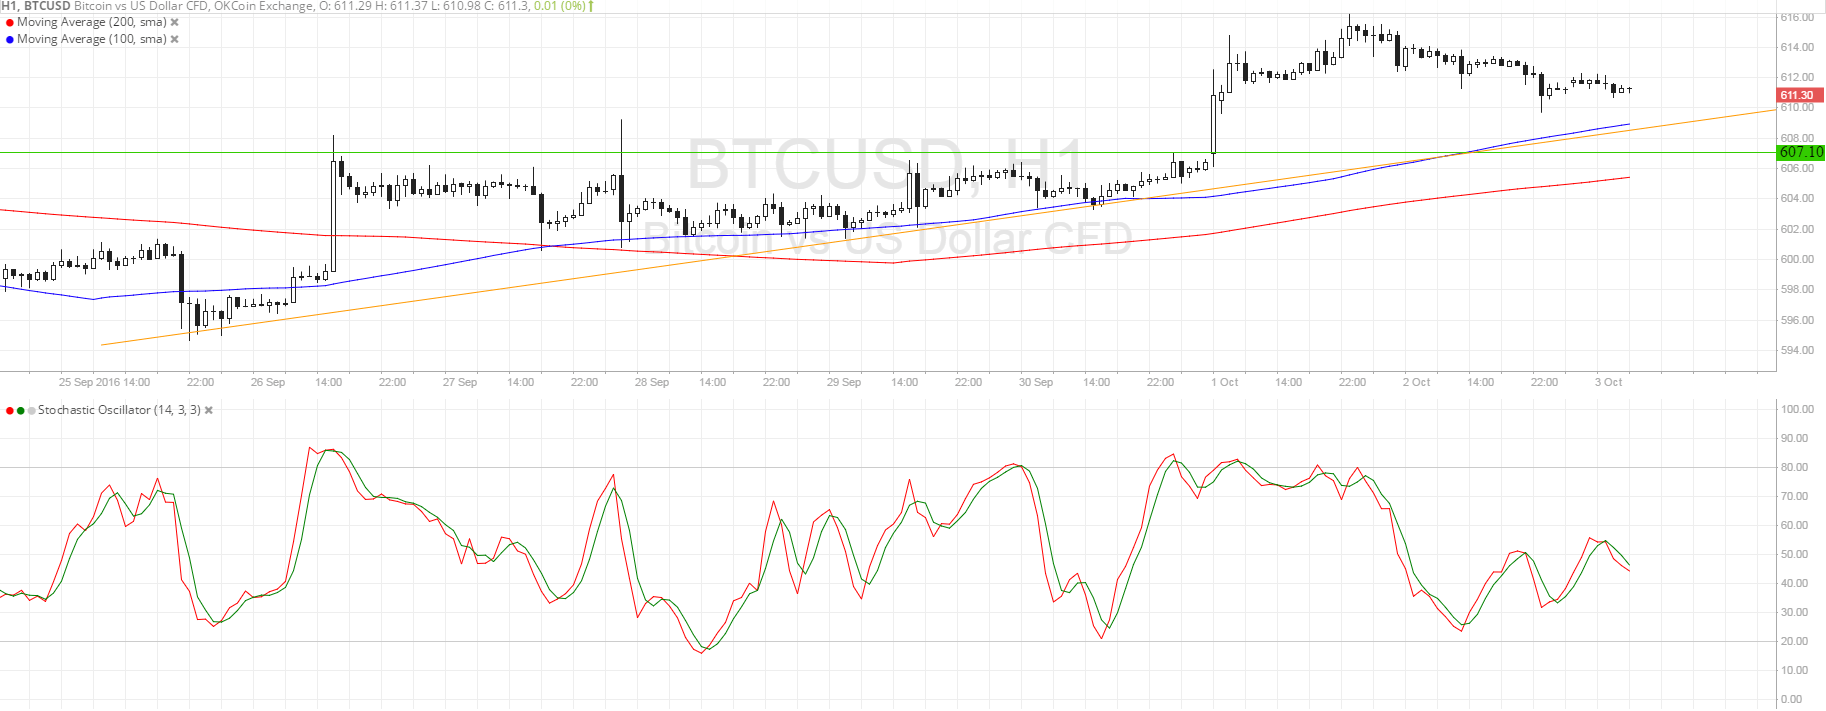
- Price just broke past the resistance at $607 then rallied up to $616 before showing signs of a correction.
- Price could retreat until the broken resistance, which is close to the rising trend line support.
Bitcoin price has been on a tear and more bulls look ready to charge after this pullback to the nearby support.
Technical Indicators Signals
The 100 SMA is above the longer-term 200 SMA on the 1-hour time frame, which means that the path of least resistance is to the upside and that the rally is likely to carry on. In addition, the 100 SMA coincides with the rising trend line, adding to its strength as a support area.
Stochastic seems to be making its way up from the oversold area to show a return in buying pressure. Also, the gap between the moving averages is widening, which means that bullish momentum is getting stronger. In that case, bitcoin price could make a move up to the recent highs at $616 or higher.
On the other hand, a move below the trend line support and 100 SMA could still find a floor around $607 or the 200 SMA at $605, which might be the line in the sand for any pullback. A break below this area could signal the start of a downtrend.

Market Events
After consolidating for the most part of the week, bitcoin price finally established a clear direction on Friday by breaking past the short-term resistance. A return in risk appetite, spurred by receding fears surrounding the Deutsche Bank news, supported bitcoin against the US dollar then.
However, profit-taking quickly took place as traders anticipate another set of catalysts this week. For one, the US will release its September non-farm payrolls report, which might give better clues on when the Fed can be able to hike interest rates. Leading jobs indicators such as the ISM PMI data and ADP non-farm employment change reading are due throughout the week, possibly giving the dollar a lead in terms of direction.
Charts from SimpleFX