Bitcoin Price Key Highlights
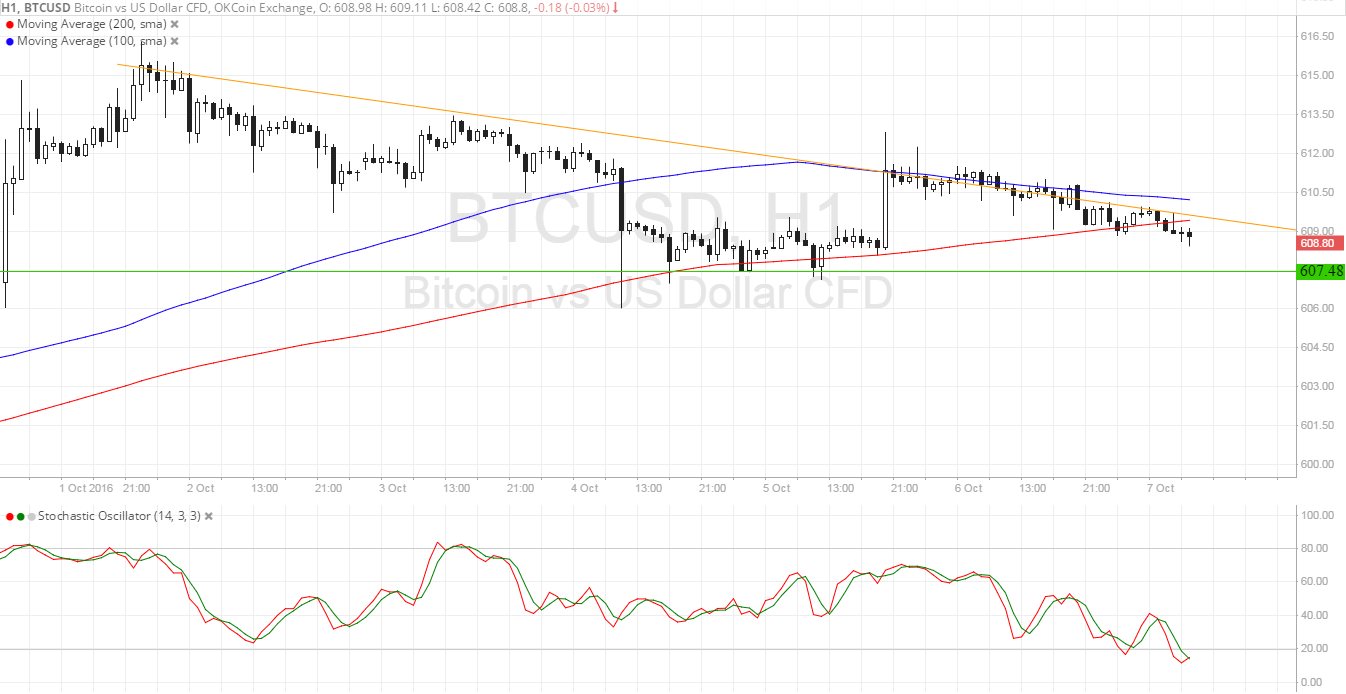
- Bitcoin price has formed lower highs and found support around $607.50, creating a descending triangle visible on its short-term time frames.
- Price seems to have gotten rejected at the resistance and is on its way towards testing support once more.
- Technical indicators are suggesting that a bounce off the area of interest could be seen.
Bitcoin price is moving inside a tiny triangle consolidation pattern but may be due for a breakout sooner or later.
Technical Indicators Signals
The 100 SMA is above the longer-term 200 SMA, which suggests that the path of least resistance is to the upside. For now, the 100 SMA has held as short-term dynamic resistance, and the narrowing gap between the moving averages suggests that a downward crossover might be imminent. If so, sellers could take control of bitcoin price action.
Stochastic is crawling down, also indicating that bearish momentum is in play. With that, bitcoin price could break below the $607.50 support area and head towards the next support at $601.50. Note that the triangle pattern spans $607.50 to $615 so any resulting breakout could last by the same amount.

Market Events
The main event for the day is the NFP release, as this would make or break Fed rate hike expectations. Market participants are setting expectations up for an upside surprise since leading indicators such as the ISM surveys and Challenger job cuts have printed improvements in hiring. Meanwhile, the ADP non-farm employment change report reflected a slowdown in employment.
A stronger than expected reading past the 171K consensus could reinforce expectations for a November hike and drive dollar demand against bitcoin price, thereby triggering a downside triangle break and a likely selloff. On the other hand, a downbeat result could lead to liquidation of dollar long positions and allow bitcoin price to take advantage and break past the triangle resistance around $610.
Liquidity appears to be thin for bitcoin recently, which suggests that volatility could pick up once large orders are seen, driving other traders to hop in strong moves as well. Keep in mind that this type of price action typically occurs around the weekend so don’t forget to make adjustments for exposure.
Charts from SimpleFX