Bitcoin Price Key Highlights
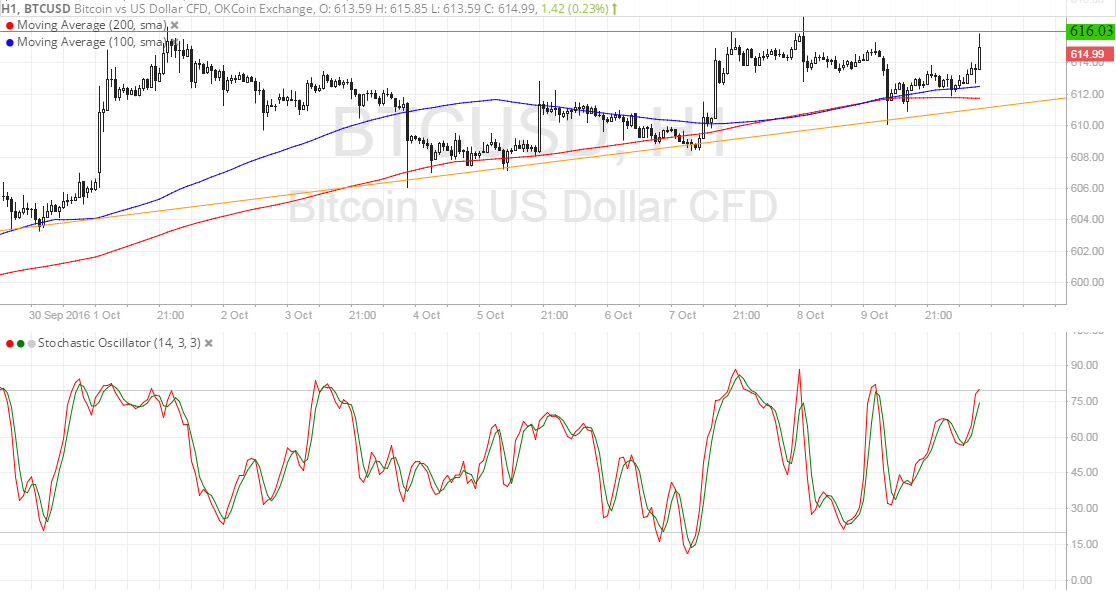
- Bitcoin price has formed higher lows and found resistance at the $616 level, creating an ascending triangle pattern on the 1-hour time frame.
- Price is currently testing the resistance and could be due for a breakout sooner or later.
- Technical indicators are giving mixed signals on where bitcoin price could go next.
Bitcoin price is trading inside a symmetrical triangle consolidation pattern and might be ready for a breakout.
Technical Indicators Signals
The 100 SMA is above the 200 SMA so the path of least resistance is to the upside. The chart pattern is approximately $15 tall so the resulting breakout could take bitcoin price up by the same amount. Similarly, a break below the triangle support at $610 could lead to a $15 drop.
Price has recently found support at the dynamic inflection points at the moving averages. These indicators are still oscillating, though, so consolidation could still carry on.
Stochastic is on the move up to reflect the presence of buying pressure. However, the oscillator is nearing the overbought zone to show that bulls are getting tired. If sellers take over, a downside breakout from the moving averages near the triangle support could be possible.

Market Events
Friday’s NFP release resulted to dollar weakness when the results fell short of estimates. The September reading stood at 156K versus the projected 171K increase while the August figure was upgraded from 151K to 167K.
The unemployment rate rose from 4.9% to 5.0% instead of holding steady as expected. Components showed that this was mostly spurred by higher labor force participation, reflecting increased confidence in the jobs market. Average hourly earnings rose 0.2% as expected, twice as much as the earlier 0.1% gain.
All in all, the jobs report wasn’t as bad as the headline readings suggested, keeping the Fed on track towards hiking interest rates before the end of the year. In that case, the US dollar still holds some upside against bitcoin price in the longer run and could be ready to regain ground, although thin liquidity during this US holiday could result to sideways action.
Charts from SimpleFX