Bitcoin Price Key Highlights
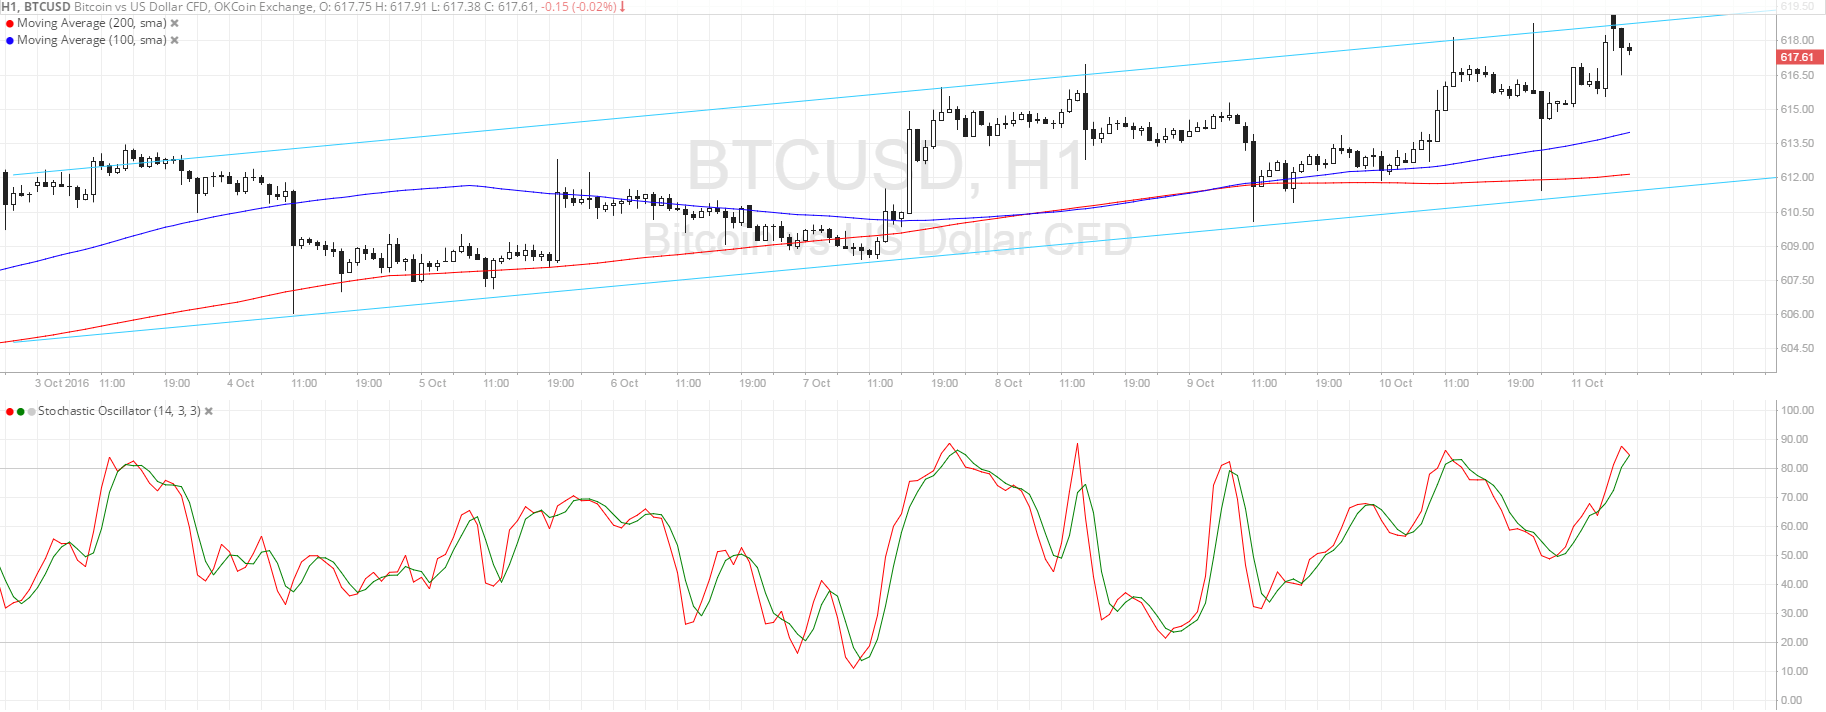
- Bitcoin price is trending higher once more, forming higher lows and higher highs inside an ascending channel pattern on the 1-hour chart.
- Price is currently testing the channel resistance and might be due for a slide back to support.
- Volatility has picked up again recently so stronger moves and potential breakouts could be seen.
Bitcoin price is trading inside an ascending channel pattern and might be due for a breakout soon.
Technical Indicators Signals
The 100 SMA is above the longer-term 200 SMA on this time frame, signaling that the path of least resistance is to the upside. Also, the gap between the moving averages is widening so bullish pressure is getting stronger. The 200 SMA is close to the bottom of the channel at $612, which might be the line in the sand for any correction from this uptrend.
Stochastic is already indicating overbought conditions so bulls could take a break from here and allow bitcoin price to retreat. A small pullback could last until the mid-channel area of interest around $615 or the 100 SMA dynamic support. Stronger selling pressure could lead to a break of the channel bottom and a reversal for the bitcoin price uptrend.

Market Events
Banks in the US, Japan, and Canada were closed for their respective holidays yesterday so liquidity was thin, making volatility understandably high. Bitcoin price tossed this way and that, establishing a slight bullish bias as risk appetite was in play.
Commodities got a boost when Russian President Putin indicated that they are willing to cooperate with any production cap or cut deal that OPEC ministers would agree upon. The upcoming informal gathering among OPEC leaders this week, excluding Iran and Iraq, could affect market sentiment especially since there aren’t a lot of major economic reports lined up.
Still, the dollar could take its cue from the FOMC minutes, as stronger hawkish biases could allow the US currency to regain ground against bitcoin price. Other reports that could influence USD action are the retail sales and PPI readings due on Friday.
Charts from SimpleFX