Bitcoin Price Key Highlights
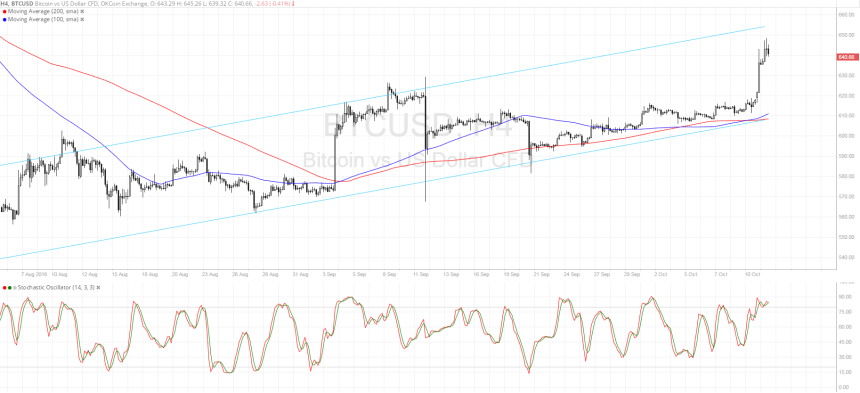
- Bitcoin price enjoyed a boost in volatility yesterday, allowing it to break past the short-term channel resistance.
- Price is now making its way to the top of a longer-term bullish channel visible on the 4-hour time frame.
- Technical indicators are also suggesting that buying pressure could be in for the long run.
Bitcoin price staged a strong rally to break past the short-term channel top and aim for the longer-term resistance.
Technical Indicators Signals
The 100 SMA is crossing above the longer-term 200 SMA to show that buyers are taking control of bitcoin price action. These moving averages are in line with the 4-hour bullish channel support at $610, adding to its strength as a floor. Bitcoin seems to have its sights set on the $650-655 area from here.
However, bearish pressure could be returning as stochastic has already reached the overbought region. The oscillator has yet to turn down to indicate that sellers are gaining control of bitcoin price action and are ready to push it back down towards support. But if buyers keep going strong, a break past the $650 resistance could take place and spur a sharper climb.
Market Events
Traders likely booked profits off their long dollar holdings ahead of the release of the FOMC meeting minutes today. The September Fed decision was to keep interest rates on hold and many are concerned that the transcript of the meeting might not be as hawkish as expected.
To top it off, medium-tier US data came in below expectations, as the Fed’s labor market conditions index slid from -1.3 to -2.2 to reflect worsening job conditions. Also, the NFIB small business index posted a weaker than expected result.
However, if the FOMC minutes turn out more upbeat than expected, the US dollar could regain ground on stronger speculations of a December hike. Recall that these tightening expectations had been dampened by the recent NFP release so dollar bulls are looking for more assurances that a hike is still possible before the end of the year.
Charts from SimpleFX
