Bitcoin Price Key Highlights
- Bitcoin price has been able to push for more gains but the rally is slowing as it approaches the all-time highs.
- Profit-taking could happen at this point, probably taking bitcoin down for a quick pullback or a larger correction.
- Technical indicators are giving mixed signals on the 4-hour time frame.
Bitcoin price is within striking distance of its record highs, so a quick bounce from profit-taking might be in the cards soon.
Technical Indicators Signals
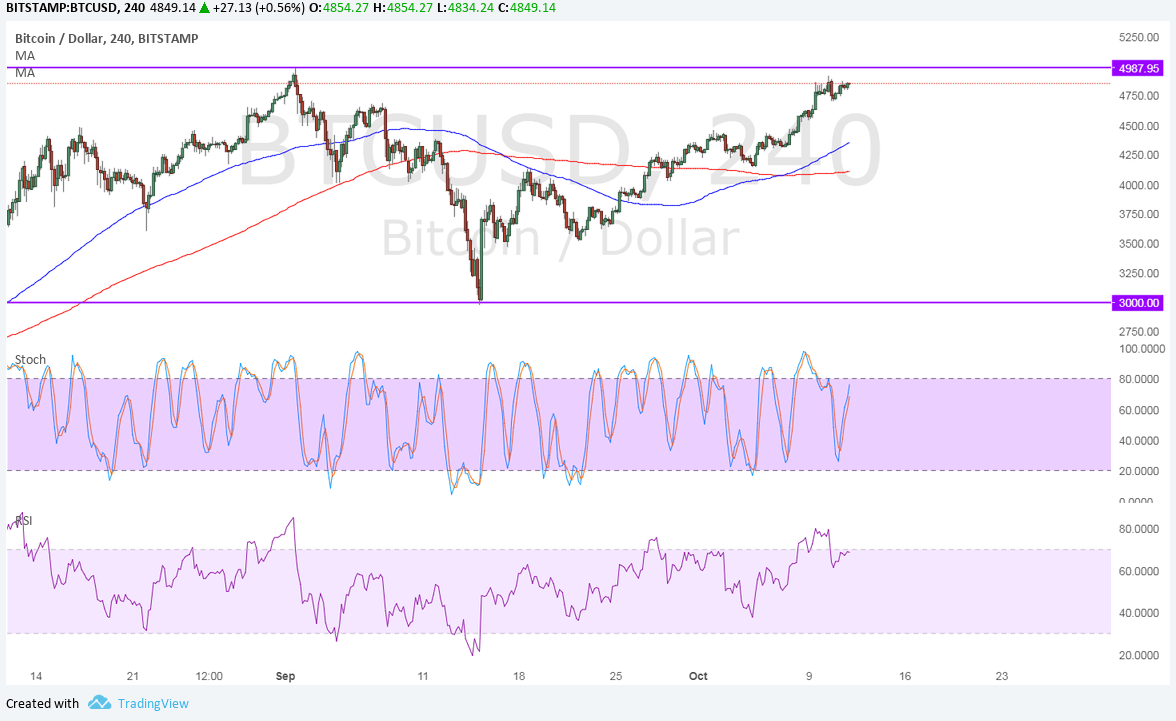
The 100 SMA is above the longer-term 200 SMA so the path of least resistance is to the upside. This means that there’s a possibility of the resistance breaking and bitcoin price going for new record highs.
Stochastic is also pointing up to show that bullish momentum is in play, but the oscillator is closing in on the overbought region to signal rally exhaustion. RSI is already turning down from the overbought level to show that bearish pressure is kicking in, possibly taking bitcoin price back down to near-term support levels.
The moving averages could serve as inflection points around $4000-4200, which are also near a rising trend line connecting the lows of bitcoin price action towards the latter part of September. A steeper selloff could find support at the lows near $3000.

Market Factors
Dollar demand has taken another hit this week after the FOMC statement reflected a divide among Fed members, casting doubts that a December rate hike is in the cards. While many policymakers thought that another rate hike is appropriate, many also expressed concerns that the drags to inflation might not be transitory.
The attention now turns to the CPI and retail sales reports due on Friday as traders try to get a better idea of how inflation is faring. Stronger than expected figures could revive tightening hopes and dollar gains versus bitcoin price while disappointing figures could allow the cryptocurrency to advance.
Traders are also positioning ahead of the bitcoin upgrade in November as many believe that it might have a similar reaction to the August hard fork.