Bitcoin Price Key Highlights
- Bitcoin price recently established strong upside momentum after breaking above a short-term ascending channel.
- Price is consolidating from here as buyers are waiting for more bulls to join.
- An upside breakout or a major pullback could offer opportunities to hop in the ongoing climb.
Bitcoin price is on a tear but is pausing in a bullish consolidation pattern before heading further north.
Technical Indicators Signals
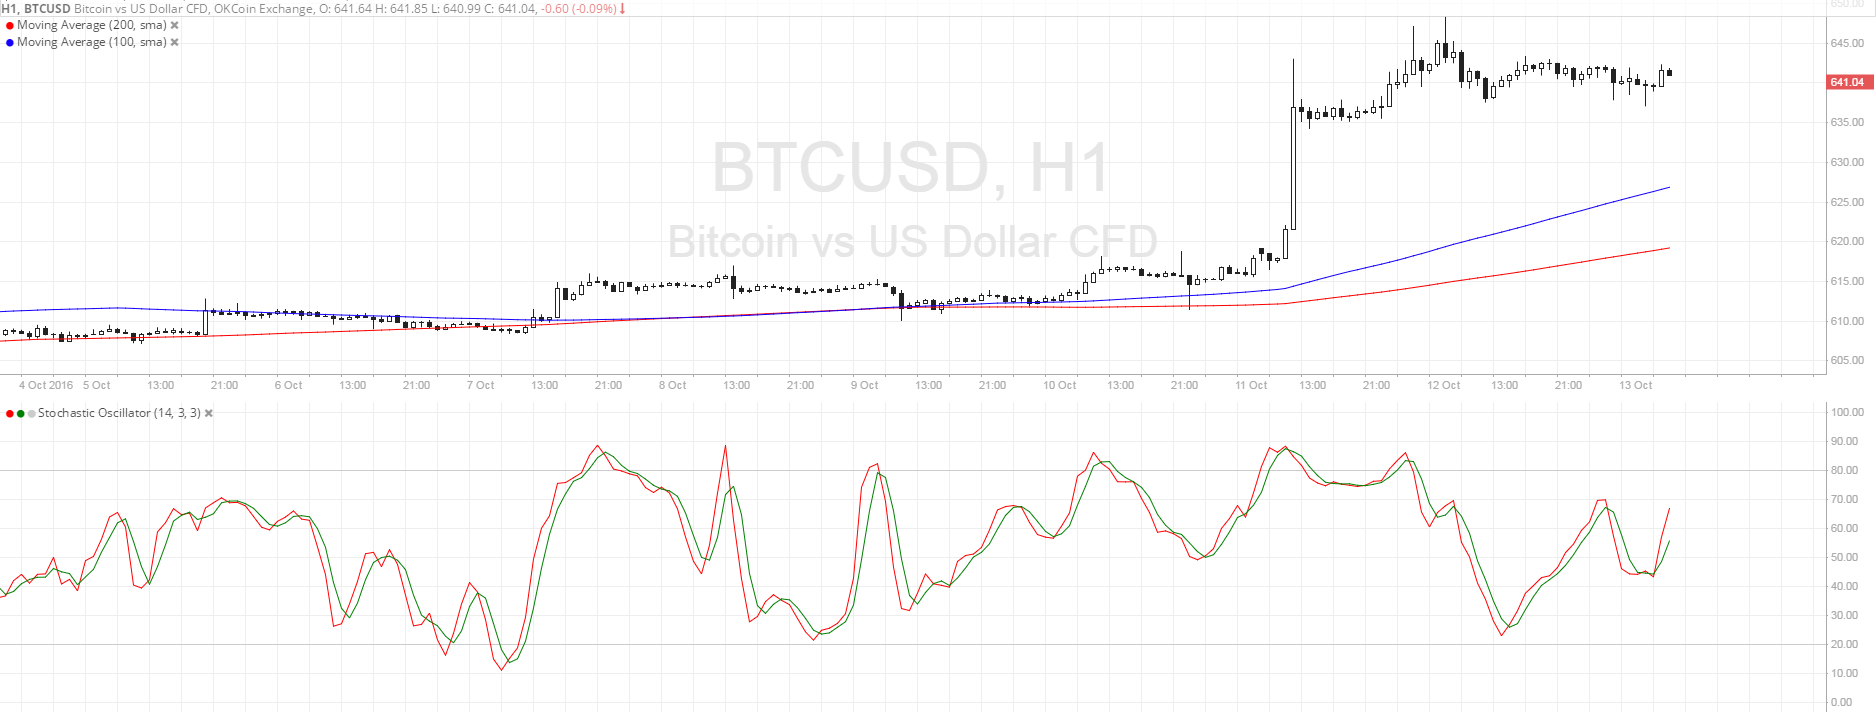
The 100 SMA is above the longer-term 200 SMA so the path of least resistance is to the upside. In addition, the gap between the moving averages is widening so bullish pressure is getting stronger. Stochastic is also on the move up to show that buyers are in control of bitcoin price action.
In case buyers run out of steam, though, bitcoin price could pull back to the nearby areas of interest which might hold as support. Closest is the consolidation bottom around $635 and next is the dynamic support at the 100 SMA just above $625. Next up is the 200 SMA around $620, which also lines up with a broken resistance level.

Market Events
The freshly released FOMC minutes did little to move bitcoin price, as the dollar scored only a few gains against its counterparts as well. Most of the remarks were already priced in and the cautious tone of some policymakers kept a lid on dollar gains. FOMC members noted that the September decision was a “close call” and that the case for a hike has strengthened, keeping December tightening expectations in play.
Up ahead, traders could turn to the retail sales and PPI figures due on Friday, as well as the preliminary consumer sentiment index from the University of Michigan. Headline retail sales could post a 0.6% rebound while core retail sales could show a 0.4% increase. Producer prices could also show slightly stronger gains, which could support stronger inflation expectations.
Signs of exhaustion can be seen in some market rallies these days, setting the stage up for potential profit-taking from the recent strong moves, which could mean a potential correction for bitcoin price.
Charts from SimpleFX