Bitcoin Price Key Highlights
- Bitcoin price broke past its all-time highs to create new ones, signaling a fresh push among bulls.
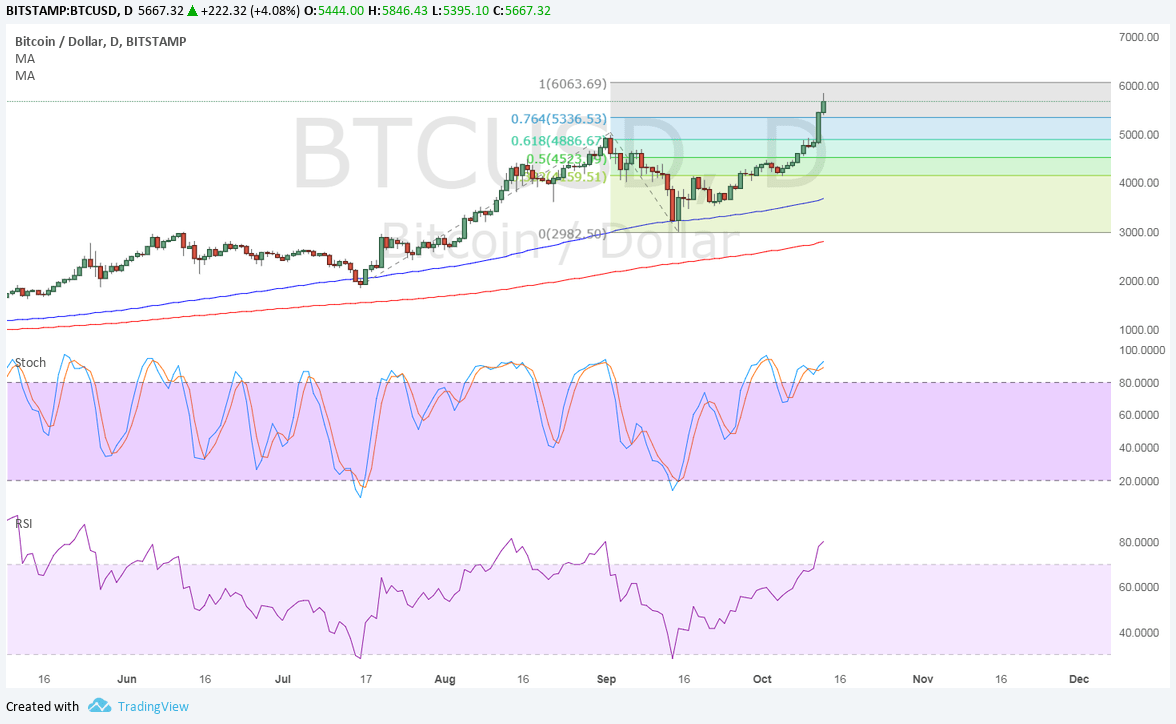
- Looking at the Fibonacci extension levels based on the latest correction move shows the next upside targets.
- Price has already breached the 76.4% extension and is making its way towards the full extension near $6000.
Bitcoin price is on a tear after establishing stronger bullish momentum on a break past the $5000 barrier, setting its sights on $6000 next.
Technical Indicators Signals
The 100 SMA is still safely above the longer-term 200 SMA so the path of least resistance is to the upside, which means that the rally is more likely to continue than to reverse. Bitcoin price has also moved past the $5000 psychological barrier, clearing the path for a move to the next ceiling at $6063.69 or the full extension.
However, stochastic is already indicating overbought conditions, which means that buyers are feeling exhausted and may let sellers take over. RSI is also in the overbought level but has yet to turn lower to indicate a return in selling pressure. If that happens, a pullback to the previous highs could be in the cards.

Market Factors
It’s hard to pinpoint the exact catalyst that spurred the strong rally but it looks like investors are positioning for another big move ahead of the network upgrade in November. Back in August, this event led to a new leg higher for bitcoin price and the cryptocurrency has managed to recover even from a series of negative updates since.
For one, China has intensified its crackdown on bitcoin by banning ICO funding and eventually shutting down exchanges. However, the large drop in volumes has slowly been made up for by other markets like Japan and South Korea.
Additional volatility is still expected moving forward, and the release of US CPI and retail sales data later today might also impact BTCUSD price. Apart from that, weakening Fed hike expectations for December are also weighing on the dollar to bitcoin’s advantage.