Bitcoin Price Key Highlights
- Bitcoin price is consolidating on its short-term time frames and for good reason.
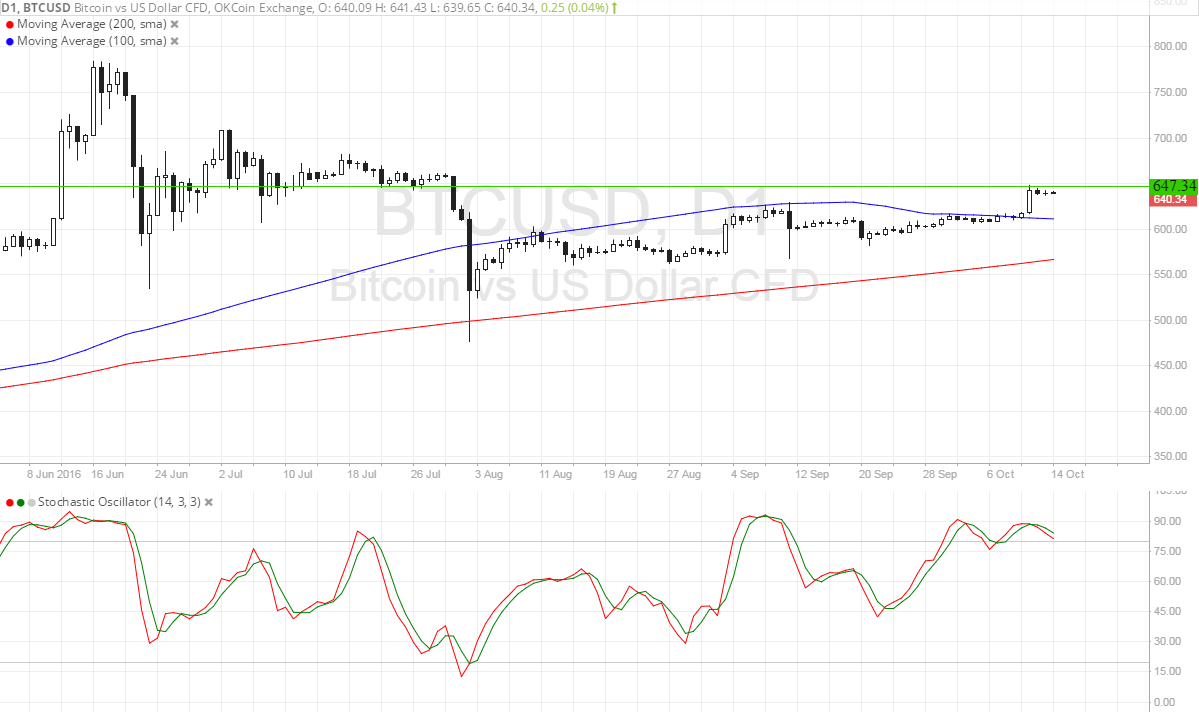
- Price is actually testing a major area of interest at $645-650, as this held as support in the past and could keep holding as a ceiling.
- Technical indicators on the longer-term charts are giving mixed signals at the moment.
Bitcoin price is stalling at a strong area of interest visible on the long-term charts, with indicators suggesting that the resistance could hold.
Technical Indicators Signals
The 100 SMA is above the longer-term 200 SMA on the daily time frame, showing that the path of least resistance is to the upside. However, the gap between the moving averages is narrowing so a downward crossover could be due. In that case, bearish pressure could return and push bitcoin price back to the near-term support at $600.
Stochastic has been indicating overbought conditions for quite some time, which means that buyers are already feeling exhausted. Once the oscillator moves below the overbought region, selling momentum could pick up and trigger a selloff.
On the other hand, if buyers keep putting up a fight, bitcoin price could push past the area of interest and go for the next ceiling around $700.

Market Events
The lack of major market catalysts for the past couple of days has kept bitcoin price in a tight range against the dollar, waiting for more clues on which direction it should take. US retail sales, PPI, and consumer sentiment figures are up for release today and these should have an impact on Fed rate hike expectations and dollar price action.
Also lined up today is a testimony by Fed Chairperson Janet Yellen herself. She sounded more hawkish than usual in her recent testimonies and any indication that she could also vote to hike rates soon might be accompanied by a strong dollar rally against bitcoin price. On the other hand, more words of caution could keep bitcoin price in consolidation.
A lot of signs of rally exhaustion are materializing on the longer-term charts so it would take a really strong catalyst to push bitcoin price past the current area of interest. In any case, volatility does pick up around this time of the week so risk adjustments could be necessary.
Charts from SimpleFX