Bitcoin Price Key Highlights
- Bitcoin price is pausing from its strong rally, consolidating on the short-term time frames while waiting for more momentum.
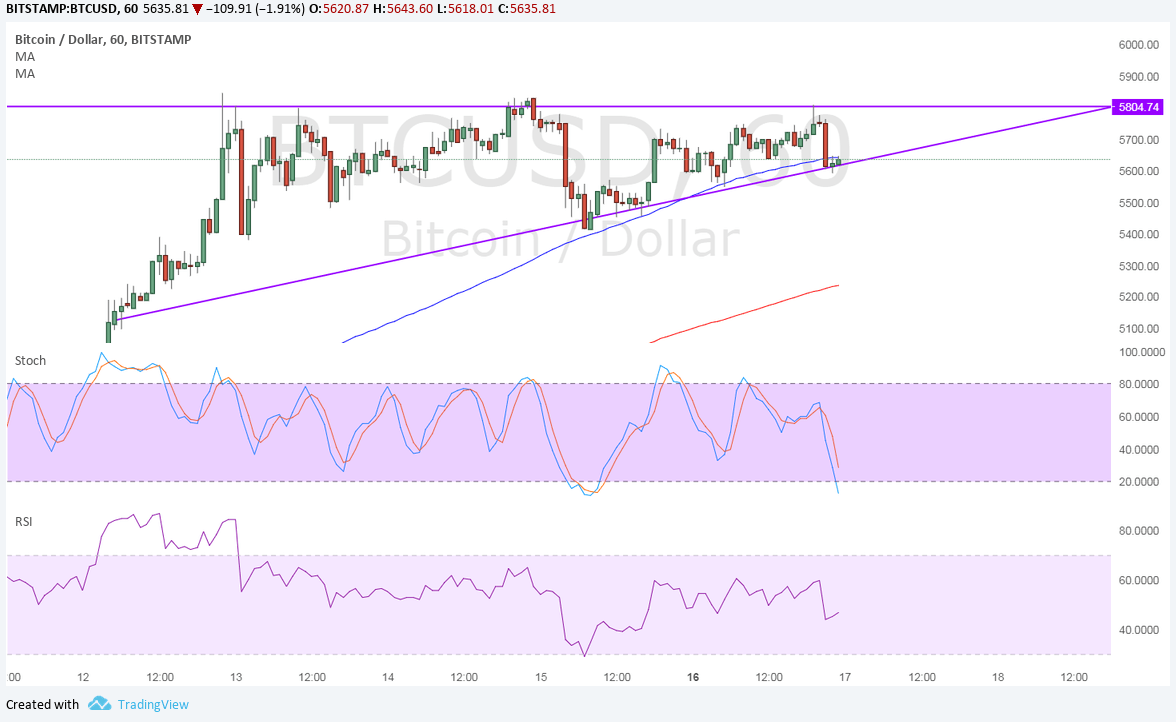
- Price has formed higher lows and found resistance around $5800, creating an ascending triangle formation.
- Price is currently testing the triangle support and could be due for a move back to the top.
Bitcoin price has formed an ascending triangle on its 1-hour time frame while waiting for more bulls to sustain the climb.
Technical Indicators Signal
The 100 SMA is above the longer-term 200 SMA to indicate that the path of least resistance is to the upside. In addition, the 100 SMA lines up with the triangle bottom and is currently holding as dynamic support.
A break below the bottom of the triangle could signal that bears are gaining control or that a larger correction from the uptrend is underway. The 200 SMA could hold as dynamic support around $5200 as well.
Stochastic is on the move down to suggest that selling pressure is in play. This oscillator is approaching oversold levels and turning higher could draw buyers back in. RSI is treading sideways so consolidation could carry on for a while.
The chart pattern spans $5100 to $5800 so the resulting move in either direction could last by the same height.

Market Factors
Bitcoin price is likely waiting for the next big catalyst, which might be the outcome of the next network upgrade in November. Investors have positioned early but are also wary of rival versions of bitcoin popping up and trying to compete for market share.
Meanwhile, the dollar is also waiting on the next set of catalysts, although the path of least resistance for the currency might be to the downside. CPI and retail sales figures have mostly disappointed while the uncertainty about the next Fed leadership is also weighing on the dollar.
US data has surprised to the upside but didn’t seem enough to convince market participants that more rate hikes are in the cards for next year. The presence of geopolitical risks from North Korea is also keeping bitcoin price supported versus the dollar.