Bitcoin Price Key Highlights
- Bitcoin price is still trending higher, trading inside an ascending channel pattern on its 4-hour time frame.
- Price is still consolidating close to the channel resistance with a bullish continuation pattern forming.
- An upside break from this flag formation could lead to a sharper climb while a downside move could lead to a test of the channel support.
Bitcoin price seems to be exhausted from its climb and might need to pull back to the channel support before heading further north.
Technical Indicators Signals
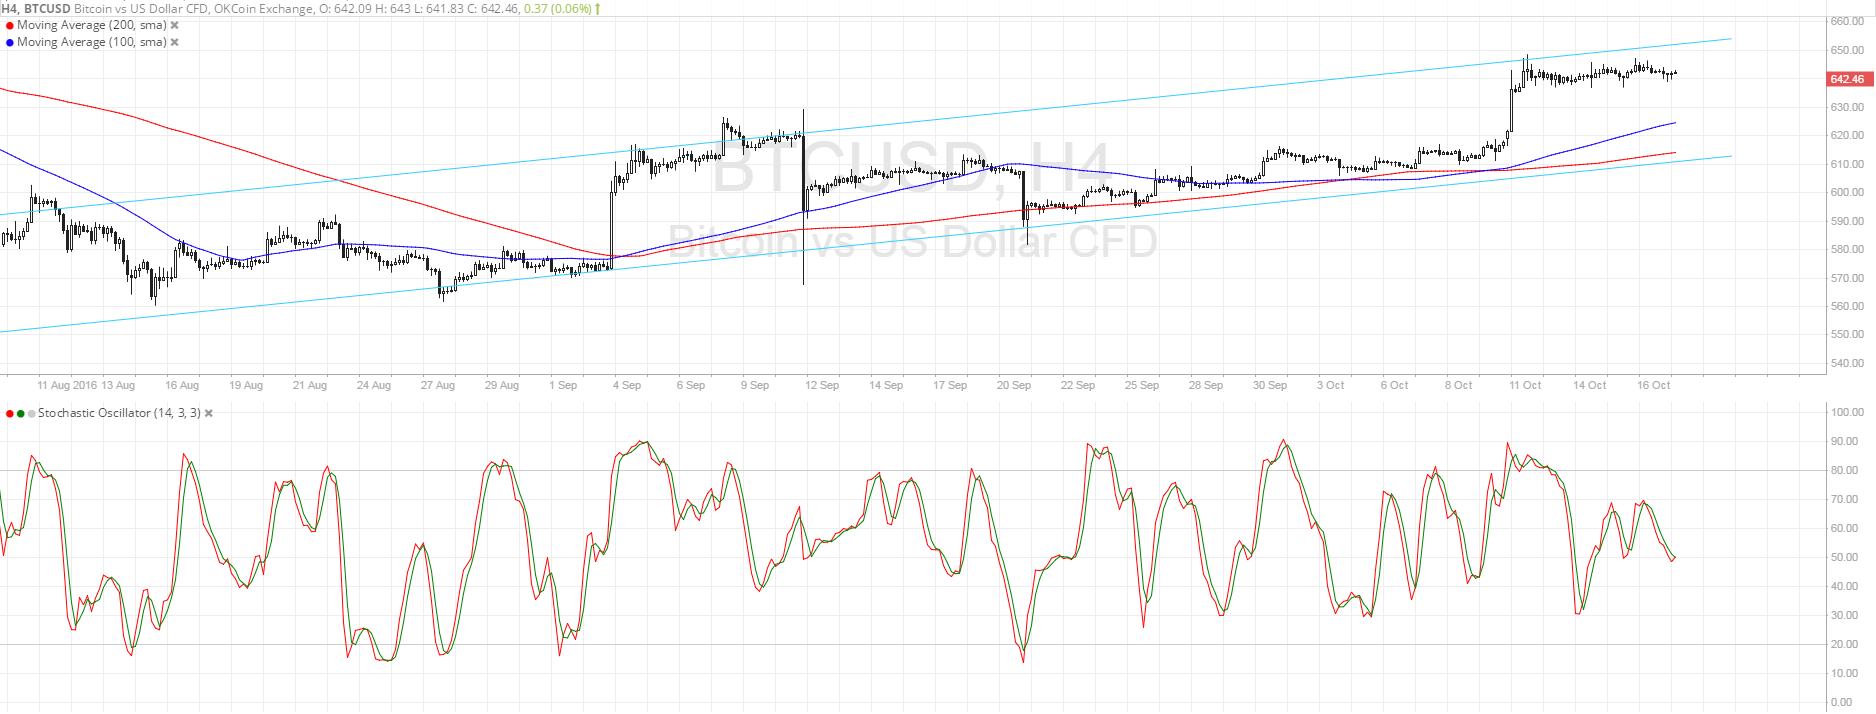
The 100 SMA is above the longer-term 200 SMA on the 4-hour chart of bitcoin price, confirming that the uptrend is likely to carry on. The gap between the moving averages is widening so bullish momentum is getting stronger. However, buyers might be waiting for better prices before entering more long positions.
A pullback to the channel support near the 200 SMA could ensue if bitcoin price breaks below the consolidation support at $640, leading to a test of the floor at $610. Stochastic is on the move down to show that a bit of selling pressure is in play.
Once the oscillator reaches the oversold zone and turns higher, buyers could regain control and push bitcoin price up to the recent highs or until the channel resistance at $650-660.

Market Events
The lack of major market events so far this week has kept bitcoin price in tight consolidation for the time being as investors wait for more directional clues. Data from the US economy has been weaker than expected on Monday but hasn’t stopped dollar bulls from supporting the currency. For today, CPI numbers are due and a significant upside or downside surprise could trigger breakouts.
If not, the tight sideways price action could carry on until the markets see a big catalyst. Potential movers include the European Central Bank’s interest rate statement, the U.K. CPI release, and the Chinese GDP report. A pickup in risk appetite could allow the bitcoin to advance against the safe-haven dollar while a return in risk aversion could draw traders back to the Greenback.
Charts from SimpleFX