Bitcoin Price Key Highlights
- Bitcoin price has bounced off the longer-term rising trend line highlighted in a previous article.
- This could mean that the cryptocurrency is set to resume its climb to new record highs, and the channel and Fib extension tool indicate the next upside targets.
- Technical indicators are also signaling that the uptrend could carry on.
Bitcoin price looks ready to resume its climb to the top of the new ascending channel or Fibonacci extension levels.
Technical Indicators Signals
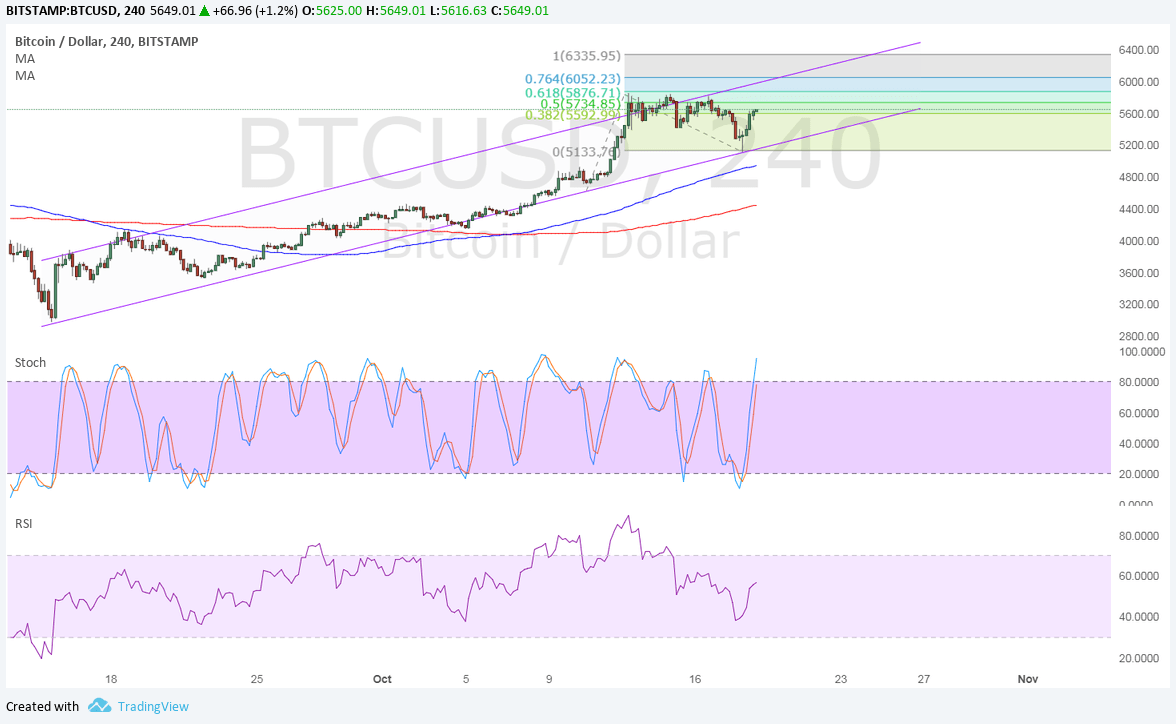
The 100 SMA is above the longer-term 200 SMA on the 4-hour time frame so the path of least resistance is still to the upside. The gap between the moving averages continues to widen, reflecting stronger bullish momentum.
The 100 SMA is also close to the bottom of the channel and spike lower, which means that it could add an extra layer of defense for bulls. A break below this region could still find a floor at the 200 SMA dynamic support.
Stochastic is pointing up to show strong buying pressure while RSI is also turning higher without even hitting oversold levels, which means that buyers are eager to hop back in. Bitcoin price is already testing the 38.2% extension near $5600 but could still go for the next resistance at the all-time highs around $5875.
From there, the 76.4% extension is located close to the channel resistance at $6052.23 while the full extension is at $6335.95.

Market Factors
Dollar demand has actually been supported in the currency markets but bitcoin price appears to be in a league of its own. The cryptocurrency had a sharp plunge earlier in the day on speculations of stricter oversight by the CFTC but technical levels held as support.
Investors must have taken advantage of the cheaper levels to load up on their long positions leading up to the network upgrade next month. Many are expecting this to pan out the same way it did in August, during which rival versions were smoked out while the network enjoyed stronger capacity to handle more transactions than before.