Bitcoin Price Key Highlights
- Bitcoin price broke down from the earlier short-term consolidation as predicted in an earlier article.
- Price is now approaching a longer-term area of interest and potential support visible on the 4-hour chart.
- There’s a confluence of inflection points all around the $620 level, which might keep losses in check.
Bitcoin price is retreating from its climb but this might offer bulls an opportunity to restart the rally at better prices.
Technical Indicators Signals
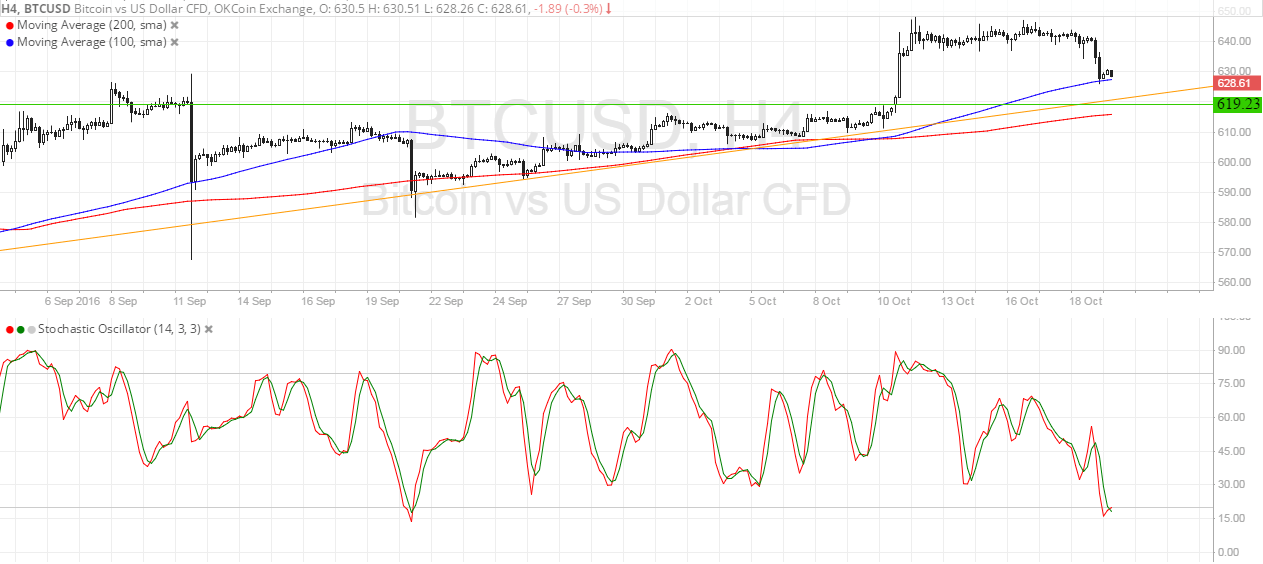
Bitcoin price is trading above a rising trend line visible on its 4-hour time frame, and this support area lines up with the broken resistance around $620. Price is finding support at the 100 SMA at the moment, which is above the longer-term 200 SMA, indicating that the path of least resistance is to the upside.
The gap between the moving averages is widening so bullish pressure is getting stronger. Stochastic is indicating oversold conditions, which means that sellers are getting exhausted and allowing buyers to take over. Also, a bit of bullish divergence can be seen since bitcoin price has higher lows while stochastic made lower lows since October 10.
A larger pullback could last until the 200 SMA dynamic support at $615, which might be the line in the sand for an uptrend correction. A break below that level could mark the start of a downtrend.

Market Events
Risk aversion seems to be taking hold of financial markets these days as investors are focusing on the risks from the Brexit. Just recently, a German politician was quoted saying that EU officials should make Brexit negotiations tough on the UK to set a precedent for other member nations, adding to earlier remarks from French President Hollande.
This led to a flight to safety which favored the lower-yielding US dollar. Apart from that, relatively upbeat reports from the US have kept Fed rate hike expectations in play, particularly since the Fed Beige Book confirmed that improvements have been consistent.
The lack of catalysts or positive news from the bitcoin front has convinced traders to book their gains off the recent long positions and hold out to reenter at better price levels instead.
Charts from SimpleFX