Bitcoin Price Key Highlights
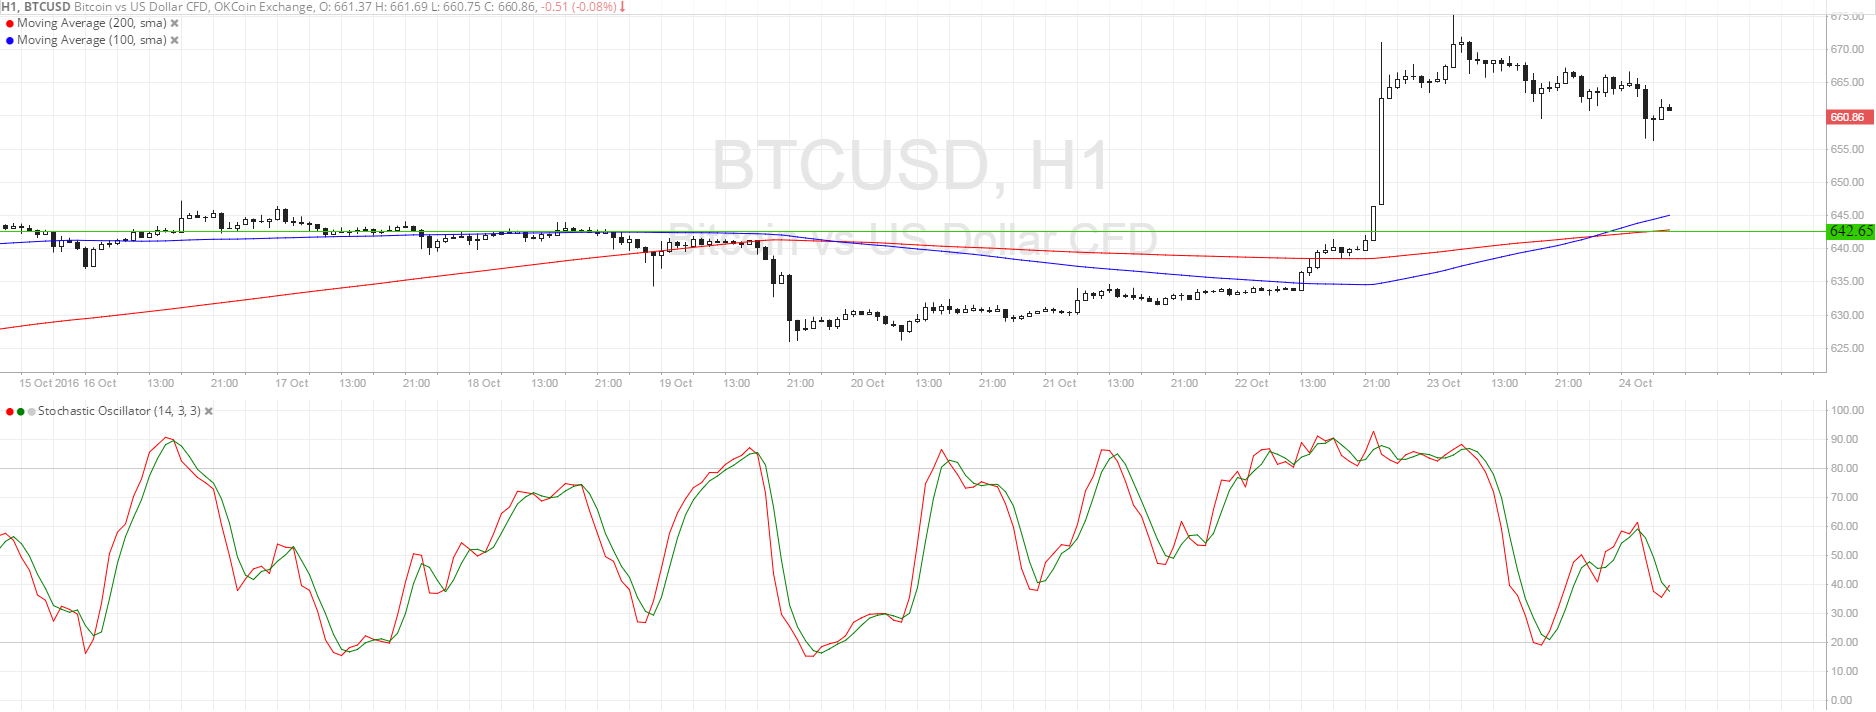
- Bitcoin price recently broke past an area of interest around $642 then rallied to the $675 area.
- From there, price retreated and is showing signs of a potential pullback to the broken resistance.
- Technical indicators are showing that the climb could resume at some point.
Bitcoin price could make a correction from its recent rally then resume the climb since bulls are waiting at the area of interest.
Technical Indicators Signals
The 100 SMA just crossed above the longer-term 200 SMA to show that the path of least resistance is to the upside and that the rally could carry on. These moving averages coincide with the area of interest around $640-645, adding to its strength as a floor.
Stochastic is on the move up to show that buyers are in control of bitcoin price action. If price bounces off any of the nearby support zones, it could make its way back up to the previous highs.
On the other hand, a move below the area of interest and moving averages could signal that bears are gaining traction and that a selloff could be in the cards, possibly until the next near-term floor at $625.

Market Events
As mentioned in the previous article, volatility does pick up at the end of the week, shaping up for that nice sharp rally on Saturday. Reports that the U.K. is pooling resources to shore up cyber security for the bitcoin network has boosted the cryptocurrency’s value, as this move would be beneficial for both companies and consumers using bitcoin.
Moving forward, there’s not much in the way of U.S. catalysts for the dollar, except perhaps for the GDP reading due later on in the week. A stronger growth figure could reinforce Fed rate hike expectations for November or December, which might allow the dollar to reassert its dominance against bitcoin. On the other hand, a slowdown in GDP growth could continue to favor the cryptocurrency against the U.S. dollar in the near-term.
Charts from SimpleFX