Bitcoin Price Key Highlights
- Bitcoin price volatility picked up recently but it was unable to bust out of its range.
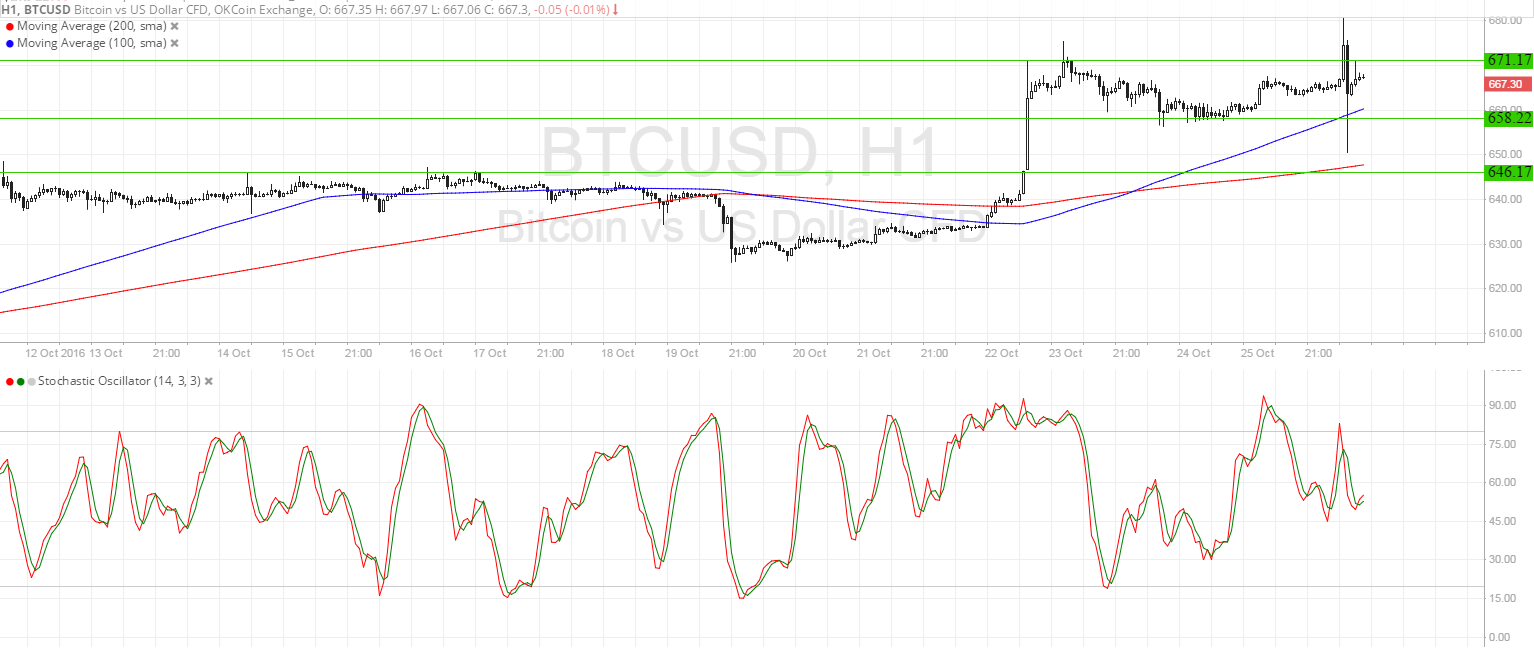
- Both bulls and bears attempted for a breakout but the cryptocurrency is still trapped between support at $658 and resistance at $670.
- Technical indicators are suggesting that the longer-term climb could carry on and that another upside breakout attempt could take place.
Bitcoin price had a volatile run but remains stuck inside its short-term range.
Technical Indicators Signals
The 100 SMA is still above the longer-term 200 SMA, which means that the path of least resistance is to the upside and that the climb could resume at some point. The gap between the moving averages is widening so bullish pressure is getting stronger. Also, the 100 SMA held as dynamic support on the brief spike down.
A break below the nearby support at $658 could lead to a drop to the next floor at $646, which previously held as resistance. This also coincides with the dynamic support at the 200 SMA.
Stochastic is heading up, also confirming that buyers are in control of bitcoin price for now. In that case, bulls could push for another move past the resistance at $670, possibly leading to a climb to the next ceiling around $680.

Market Events
Reports that more Chinese investors are increasing their bitcoin holdings has kept the cryptocurrency supported for most of the week on the heels of yuan devaluation and a mining conference in Chengdu.
Meanwhile, the US dollar hasn’t seen a lot of catalysts recently as European currencies have been dominating the headlines. Apart from that, the pickup in volatility among commodities, particularly oil and precious metals, has also translated to stronger moves in bitcoin.
Up ahead, US durable goods orders data is lined up but this might not carry much weight on BTCUSD direction. A larger catalyst could be the US advance GDP reading due on Friday, which might show a 2.5% growth figure, up from the earlier 1.4% expansion. Stronger than expected data could boost the dollar against bitcoin price on renewed November Fed hike expectations.
Charts from SimpleFX