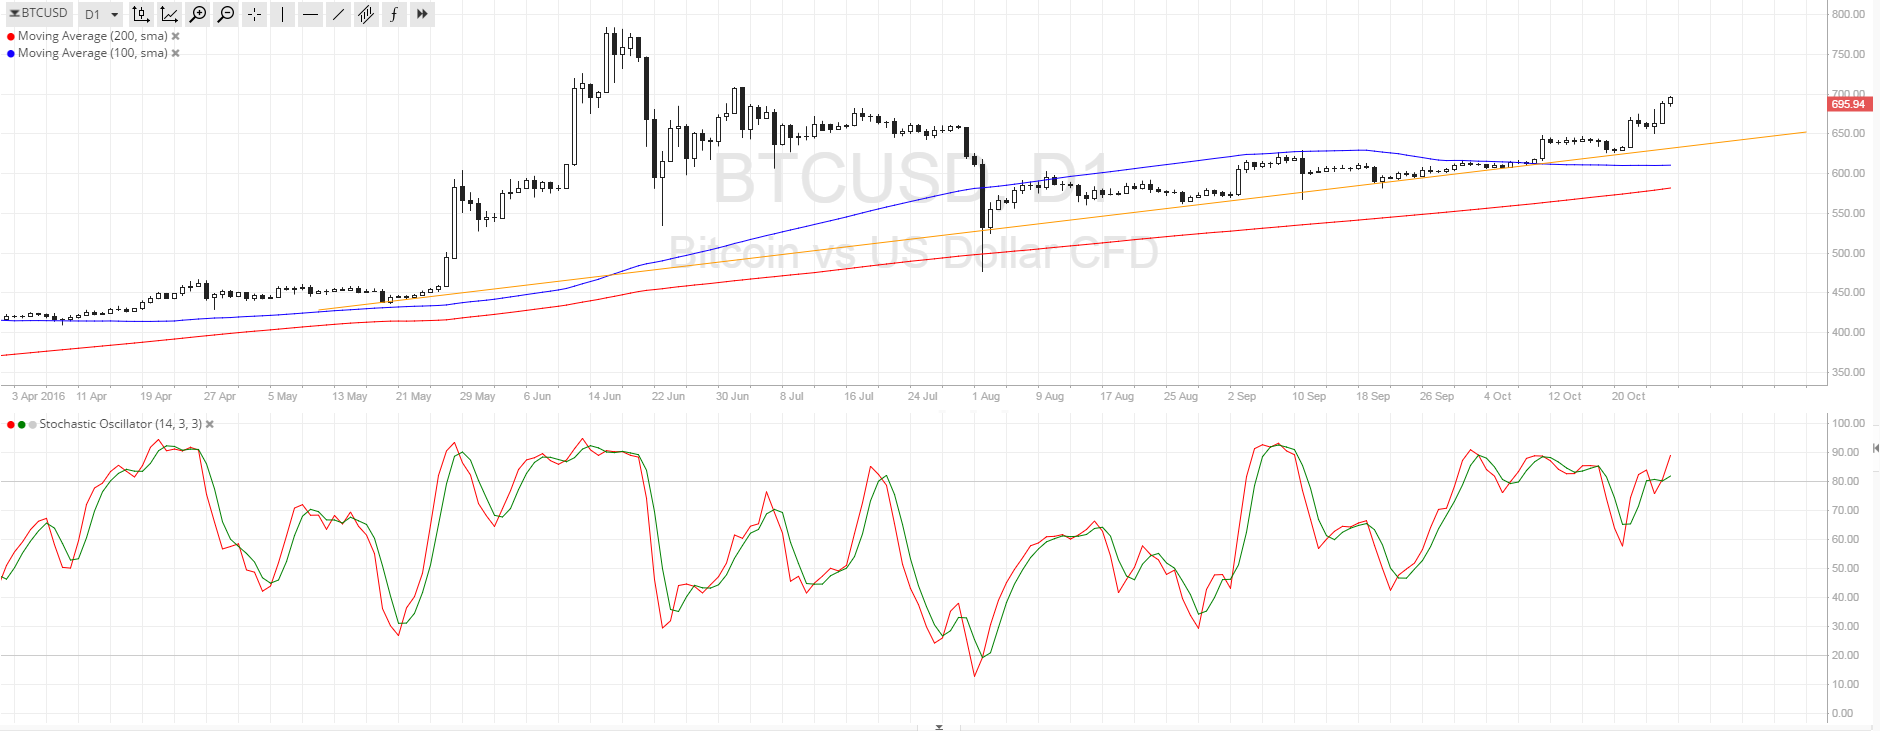
Bitcoin Price Key Highlights
- Bitcoin price made a strong upside break of the near-term resistance marked in a previous article.
- This suggests that bulls are gaining strength and could push price to the next ceiling.
- At the moment, bitcoin is testing the area of interest at $700, which is a major psychological level.
Bitcoin price could be due for more gains after this upside breakout, possibly aiming for the $750 level next.
Technical Indicators Signals
The 100 SMA is above the longer-term 200 SMA so the path of least resistance is to the upside, even on this daily chart. However, the gap between the moving averages is narrowing to show weakening bullish momentum and a potential downward crossover.
If that happens, sellers could regain control of price action and push for a correction. Bitcoin price could retreat to the rising trend line around $650, which is also near the dynamic support at the 100 SMA.
Stochastic is still pointing up to indicate that there’s buying momentum left for the cryptocurrency to extend its rally. Once the oscillator reaches the overbought zone and turns down, though, a bit of bearish pressure could return and a break below the line in the sand at the 200 SMA dynamic support could spur a downtrend.

Market Events
Developments in the cryptocurrency industry continue to support bitcoin price, particularly against its rivals such as ethereum, which is currently undergoing a hard fork and some security issues. Apart from that the inflow of money from Chinese investors is providing a fresh boost for bitcoin these days, as the yuan is under threat of devaluation.
Meanwhile, traders are lightening up on their long dollar positions even as U.S. data has surprised to the upside. Fed rate hike expectations are still in play but the odds could still hinge on the upcoming NFP release next week, as weak results could dash hopes for tightening as early as November.
In any case, risk appetite is present in the financial markets still, which is also good for bitcoin price. Be on the lookout for the US advanced GDP release on Friday as this could also impact sentiment before volatility picks up over the weekend.
Charts from SimpleFX