Bitcoin Price Key Highlights
- Bitcoin price is still on a bullish track after completing a large correction and recovering.
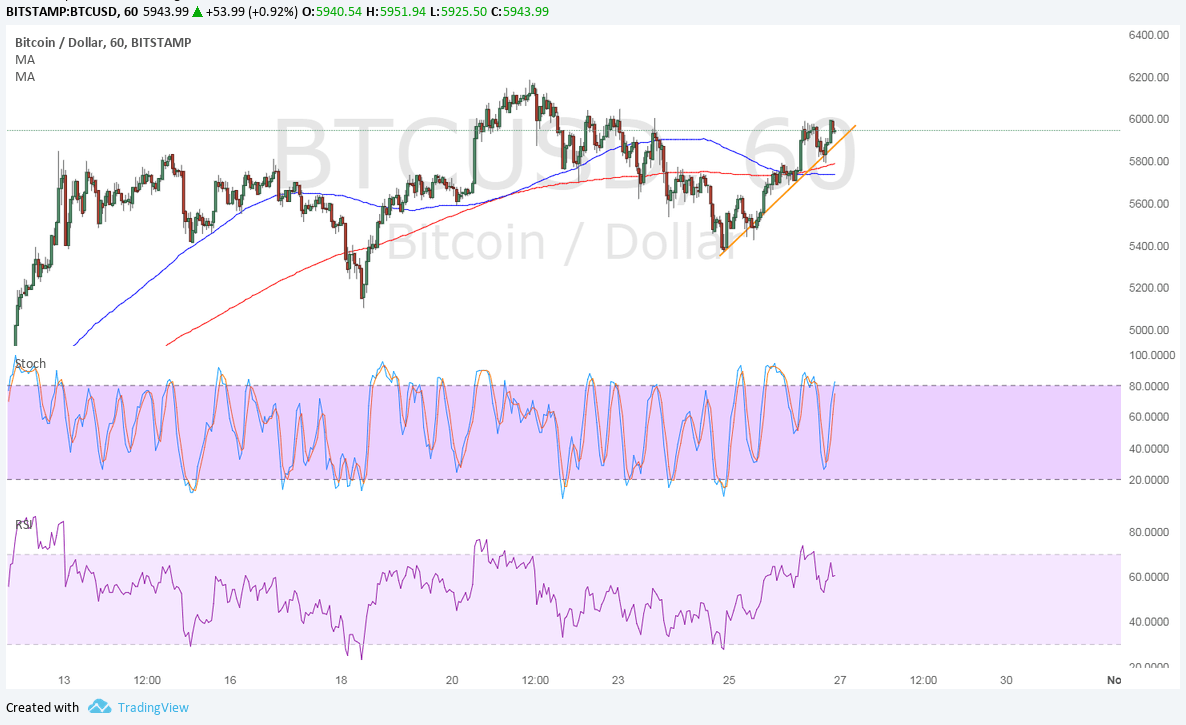
- Price is moving above a short-term ascending trend line and a break below this could signal a return in bearish pressure.
- Technical indicators are also suggesting that the rally could stall. If so, a head and shoulders pattern could form.
Bitcoin price is trying to keep up its rally, but there are signs of bullish exhaustion and a potential reversal pattern.
Technical Indicators Signals
The 100 SMA has crossed below the longer-term 200 SMA on the 1-hour time frame to suggest that the path of least resistance is to the downside. This signals that bitcoin price could have a tough time testing or breaking past the record highs from here.
Stochastic is heading north so bulls could still have a fighting chance, but this oscillator is approaching overbought levels to indicate a potential turnaround. RSI is already heading south to show that sellers are regaining the upper hand.
A break below the short-term trend line could lead to a drop to the $5200-5400 zone, which would be the neckline of this potential head and shoulders reversal formation. From there, a break below the neckline could lead to a selloff of around $800-1000 or the same height as the chart formation.

Market Factors
Bitcoin is nearing its network upgrade which could draw more support for the core version as it becomes capable of handling more transactions than before. If rival versions are smoked out like before, bitcoin price could exhibit the same behavior as in the August hard fork.
However, bitcoin price could also be sensitive to dollar moves from here as the Trump administration is taking strides in tax reform. A budget resolution passed by the House could allow a tax bill to make it past Senate without needing to secure supermajority. Apart from that, the upcoming advance GDP reading could spur additional volatility, along with Trump’s Fed Chairperson announcement which might happen anytime soon.