Bitcoin Price Key Highlights
- Bitcoin price sold off quickly on Friday but bulls were waiting to charge at the rising trend line.
- Price could resume its climb from here as technical indicators on the 1-hour time frame suggest that the uptrend could stay intact.
- A return in bullish pressure could push bitcoin up to the recent highs near $730 or higher.
Bitcoin price gave up ground to the dollar on Friday but buyers soon returned at a key area of interest.
Technical Indicators Signals
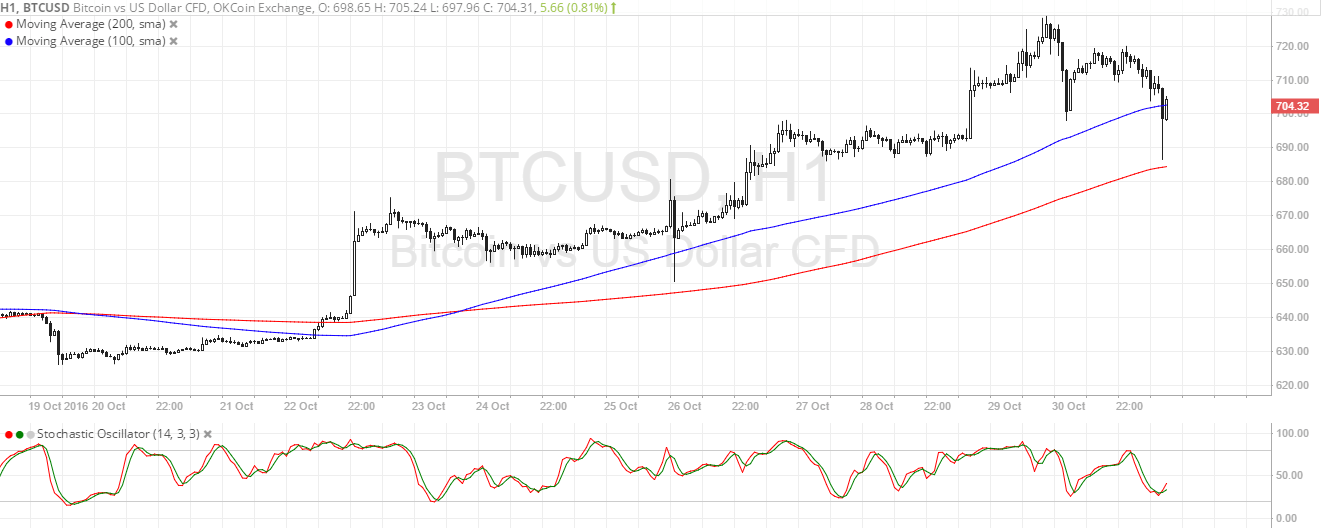
The 100 SMA is above the longer-term 200 SMA on this time frame so the path of least resistance is still to the upside. Price dipped below the 100 SMA but it appears as though it turned near the 200 SMA dynamic support. Also, the gap between the moving averages is widening so bullish pressure is getting stronger.
Stochastic is turning higher even without hitting the oversold area, indicating that buying momentum is indeed returning and might be enough to take bitcoin price to its previous highs and beyond. However, a return in selling pressure could lead to another test of the 200 SMA support at $690 or perhaps even a break lower. In that case, more sellers could hop in and trigger a longer-term drop,

Market Events
The US printed a stronger than expected Q3 advanced GDP reading on Friday, supported by a higher GDP price index for the third quarter as well. The economy expanded by 2.9% versus the 2.5% forecast, higher than the upgraded 1.4% growth figure for Q2 also. This confirms that the US economy is gaining more positive momentum, keeping the Fed on track towards hiking interest rates by December.
However, the dollar returned a lot of its recent gains before the week came to a close after the FBI announced its probe into Democratic presidential candidate Hillary Clinton’s private email server. This could keep markets on their toes ahead of the November 8 elections as this issue could cast doubts on Clinton’s victory, possibly leading investors to move funds away from US assets for the time being and onto alternative investments such as bitcoin.
Charts from SimpleFX