Bitcoin Price Key Highlights
- Bitcoin price continues to trend higher on its 1-hour time frame, moving on a sharper ascending channel than before.
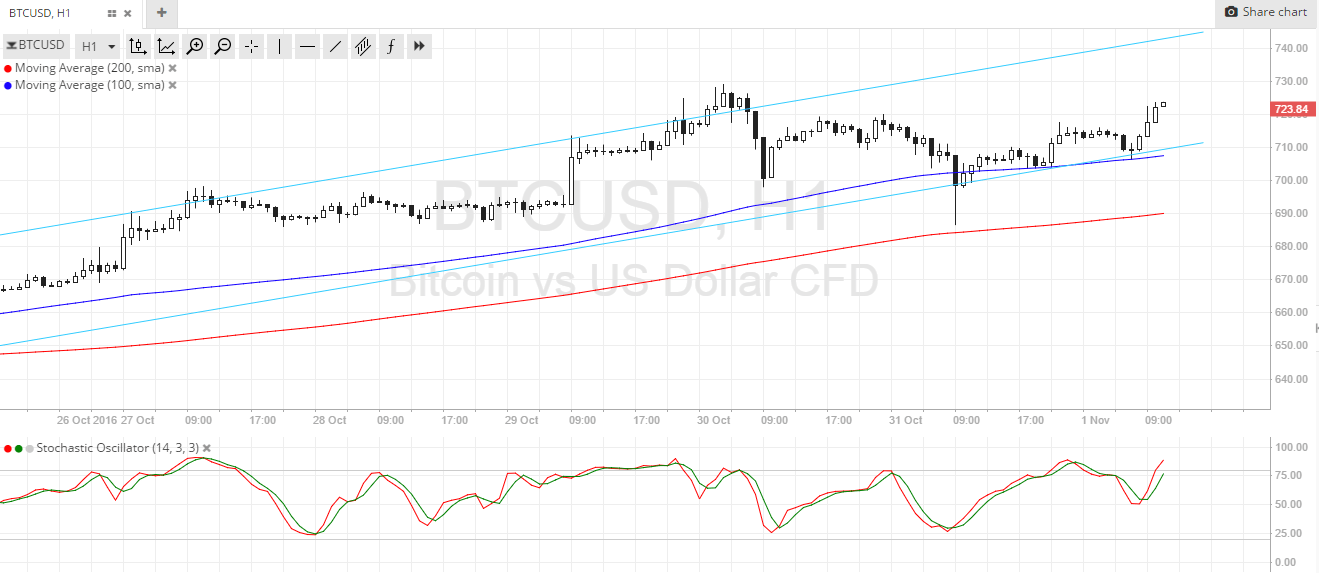
- Price just bounced off the channel support and seems to be setting its sights on the resistance around $740-750.
- Technical indicators are suggesting that further gains are in the cards.
Bitcoin price is resuming its climb after testing the bottom of the ascending channel visible on the 1-hour chart.
Technical Indicators Signals
The 100 SMA is safely above the longer-term 200 SMA on this time frame, confirming that the path of least resistance is still to the upside and that the rally has legs. The 100 SMA coincides with the ascending channel support, adding to its strength as a floor in case another test of the bottom around $710 occurs.
A break below the channel support could lead to a selloff until the next dynamic inflection point around the 200 SMA or $690 level, but a break below this line in the sand could signal the start of a downtrend.
Stochastic is still pointing up, which means that there’s bullish momentum left for more gains. However, the oscillator is already in the overbought zone, which means that buyers are already exhausted. If profit-taking happens and sellers take over, bitcoin price could head south or at least trade sideways.

Market Events
The US dollar has been tossing and turning along with bitcoin price on shifting market sentiment. So far, risk appetite is looking shaky due to the FBI’s probe on Clinton’s private email server less than a week to the November 8 elections, causing the Democratic candidate’s lead against Trump to narrow in recent polls.
The upcoming FOMC statement could also prove to be an event risk for the financial markets, although no actual policy changes are expected. Stronger hints of a rate hike in their December meeting could reinforce dollar strength against bitcoin price, though.
Still, the cryptocurrency could stay supported in the long haul, owing to positive developments in the industry itself. This might be enough to keep bitcoin price safely inside the rising channel pattern or even set it off on a much stronger climb later on.
Charts from SimpleFX