Bitcoin Price Key Highlights
- Bitcoin price was almost non-stop in its climb last week, reaching new highs past the $7500 mark.
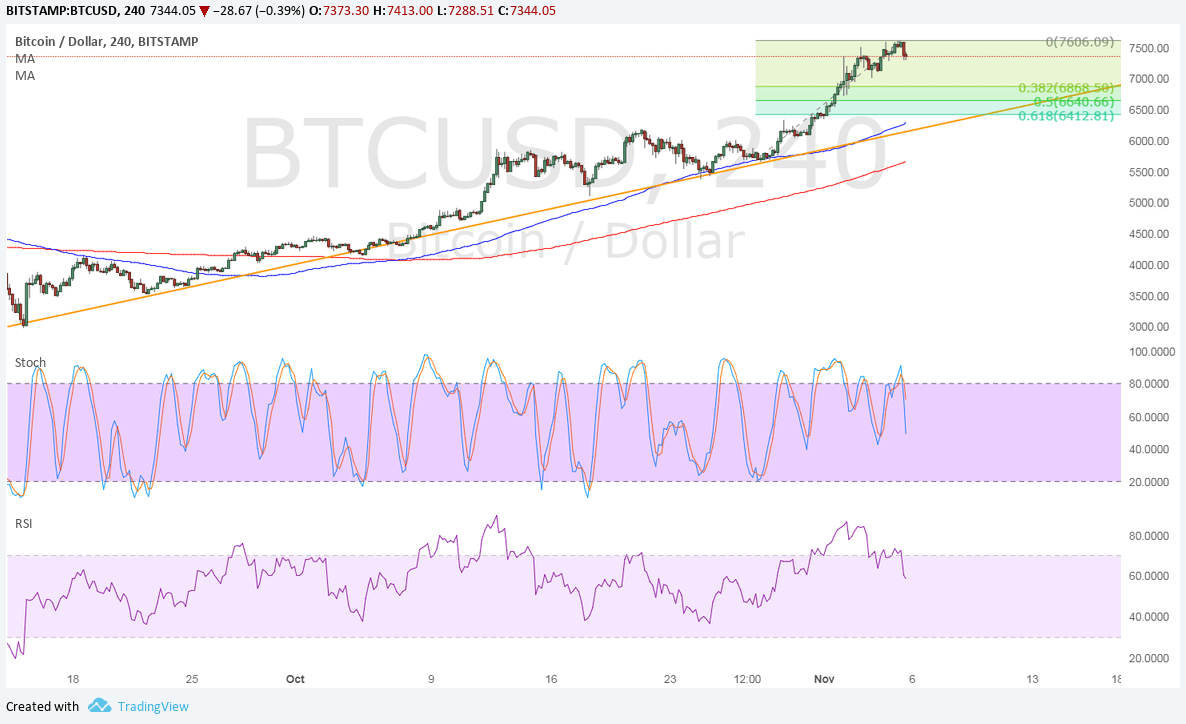
- Price appears ready for a pullback from here and the 61.8% Fib lines up with the trend line support.
- Oscillators are hinting at uptrend exhaustion so a correction might be needed before bitcoin price heads further north.
Bitcoin price had a stellar rally in the past few days but could be due for a quick pullback to draw more buyers in.
Technical Indicators Signals
The 100 SMA is above the longer-term 200 SMA so the path of least resistance is to the upside. In other words, the rally is more likely to carry on than to reverse. In addition, the 100 SMA lines up with the rising trend line support near $6300, which might keep losses in check.
However, stochastic is heading down from the overbought region to signal the return in bearish pressure. RSI is also turning lower and ready to move south so bitcoin price might follow suit until both indicators hit oversold levels.

Market Factors
The US NFP reading turned out weaker than expected on Friday, contributing to dollar weakness. The economy added only 261K job versus the estimated 312K increase but the unemployment rate still fell from 4.2% to 4.1%. Average hourly earnings were flat to indicate lack of wage growth and potentially weaker inflationary pressures down the line.
As for bitcoin price itself, investors still seem optimistic about the outcome of the network upgrade since this would allow the cryptocurrency to handle more transactions.
Apart from that, volume from South Korea and Japan has been advancing as several conventional traders are also starting to put funds in bitcoin. In Japan, largest retailer in Bic Camera, budget hotel chain Capsule, major airline Peach, and the country’s largest grid operator Remixpoint accept bitcoin as a currency.
In the US, investors are also looking forward to the launch of bitcoin futures by CME before the end of the year, pending regulation.
SaveSave
SaveSave