Bitcoin Price Key Highlights
- Bitcoin price recently broke to the downside of its short-term uptrend, signaling a reversal underway.
- Price is stuck in consolidation for the time being, as traders have been booking profits from the previous drop and waiting for more cues.
- A break below the rising wedge pattern could confirm that longer-term losses are in the cards.
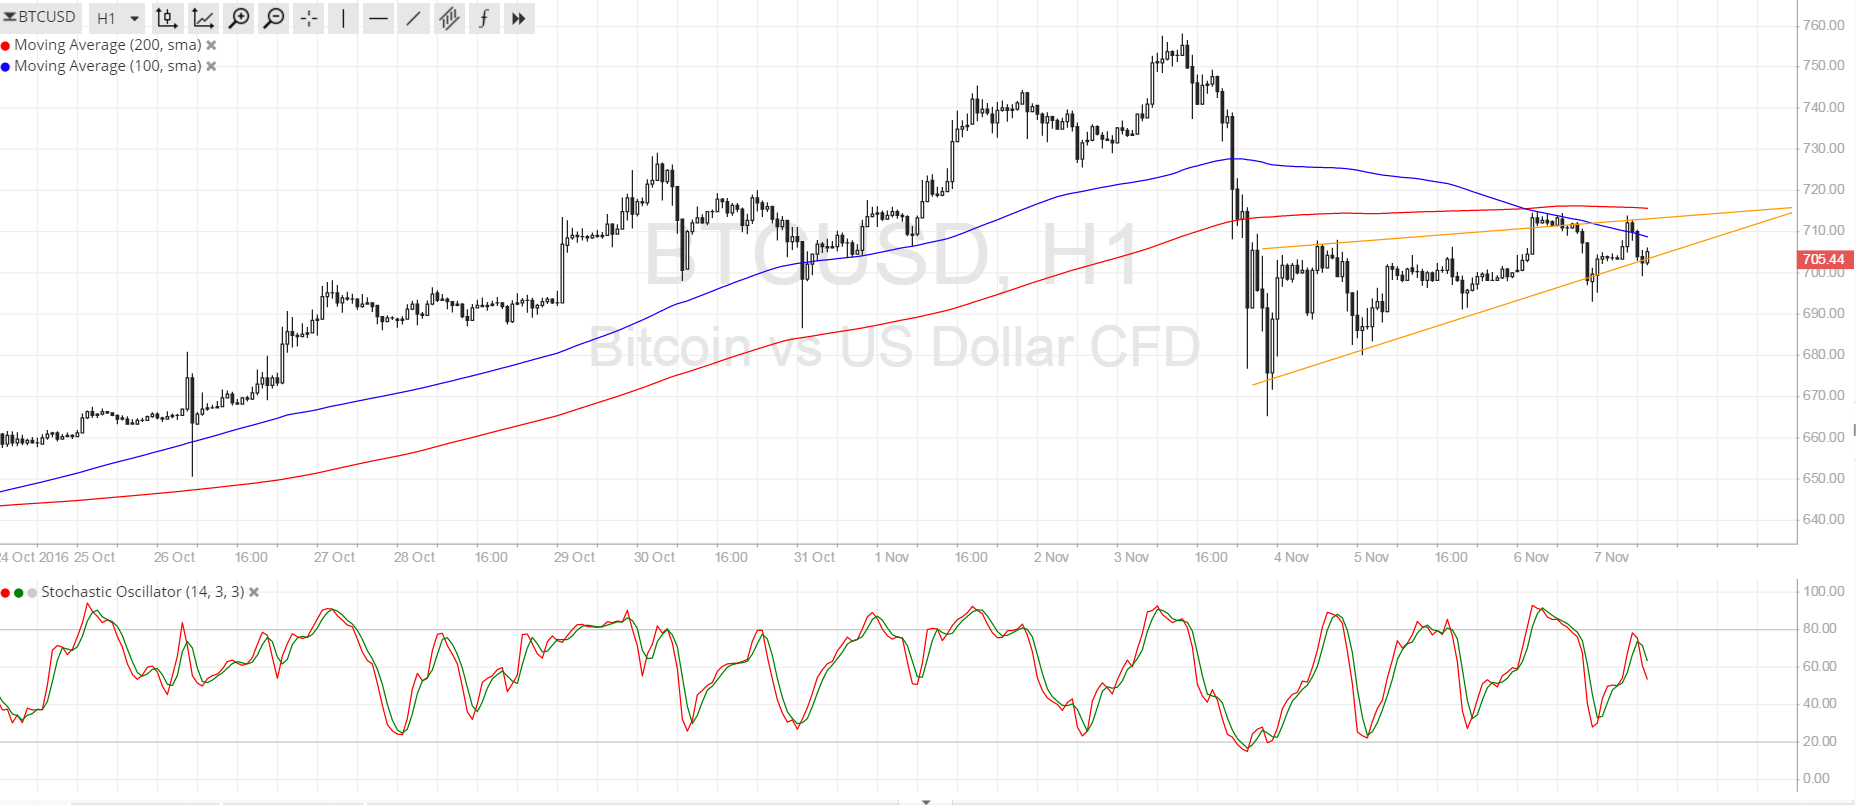
Bitcoin price is consolidating in a rising wedge pattern and the direction of its breakout could set the tone for long-term movement.
Technical Indicators Signals
The 100 SMA just recently crossed below the longer-term 200 SMA to show that the path of least resistance is to the downside. In addition, the 100 SMA seems to be holding as a dynamic inflection point and keeping gains in check. This might take bitcoin price below the wedge bottom at $700 and onto the next floor at $670.
On the other hand, a rally off this wedge support could lead to another test of resistance at $715 and perhaps even an upside breakout. If so, the 200 SMA could still hold as near-term resistance, although a move higher could allow bulls to reestablish their long biases.
Stochastic is pointing down without having even to reach the overbought zone, which suggests that bears are eager to push bitcoin price lower. A stronger selloff could push it all the way down to the longer-term area of interest at $650.

Market Events
The upcoming US elections seems to be keeping traders in a cautious mood for the time being, as the event could have a strong impact on the global economy and overall market sentiment. A Clinton victory is seen to restore confidence in the US market, which might be bullish for the dollar against bitcoin price, while a Trump victory could bring more uncertainty to the mix.
So far, reports that the Chinese government is about to pursue restrictions on bitcoin trading in the mainland have also been keeping a lid on the cryptocurrency’s gains. Traders are also on their toes for any updates on this theme, although most industry experts asserted that authorities don’t have much control in the bitcoin sphere.
Charts from SimpleFX