Bitcoin Price Key Highlights
- Bitcoin price was previously stuck in consolidation but eventually broke to the upside as the US election results are coming in.
- Risk aversion is clearly favoring bitcoin at the moment, with the US dollar giving up ground as Trump takes the lead.
- Price could be in for more gains now that bullish momentum has picked up, but technical indicators say otherwise.
Bitcoin price decided to pick the northbound route, spurred by uncertainty gripping the financial markets so far.
Technical Indicators Signals
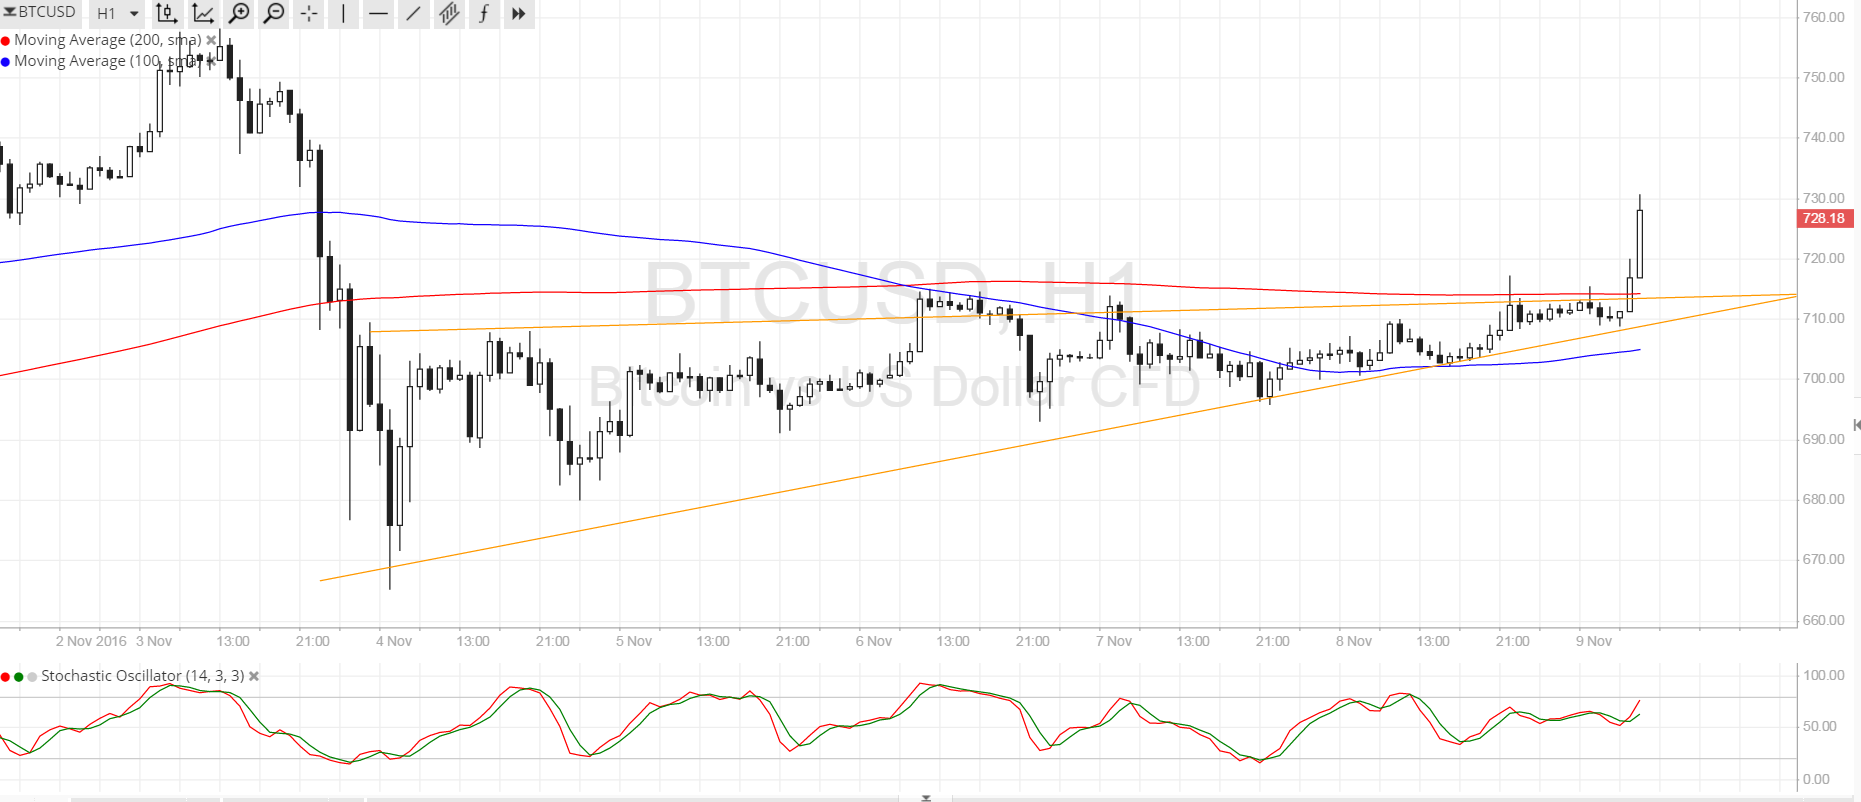
The 100 SMA is still below the 200 SMA on this short-term bitcoin chart so the path of least resistance could be to the downside, possibly yielding a correction to the broken resistance before heading further north. However, momentum is siding with the bulls at the moment due to market catalysts. Also, the price break past the 200 SMA suggests that an upward crossover could be due sooner or later.
Stochastic is treading sideways but is on the move up, nearing the overbought region already. If the oscillator turns down from here, sellers could return to the game and push for a drop towards the wedge support and rising trend line at $710. On the other hand, a continued climb could take bitcoin price all the way up to the $755 area and beyond.

Market Events
All eyes and ears are on the US election results right now, especially since most market watchers are surprised that Trump is leading against Clinton. A victory by the Republican nominee would bring more uncertainty to the financial markets and global economy, which explains the rise in alternative investments like bitcoin.
To top it off, a Trump win could also discourage the Fed from hiking interest rates in December in order to give the US economy time to adjust to likely fiscal and economic changes. This would dampen demand for the US dollar, which has been gaining ground earlier in the year on tightening expectations.
Still, it might be too early to call as the counting process could go on for a few more hours and there’s a chance for Clinton to overtake and restore calm in the financial markets, reviving gains for the dollar against bitcoin price.
Charts from SimpleFX